- Home >
- Stock Photos >
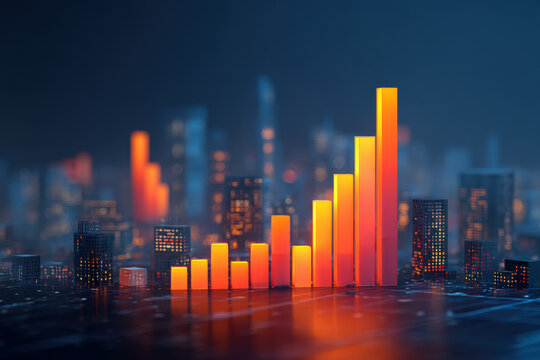
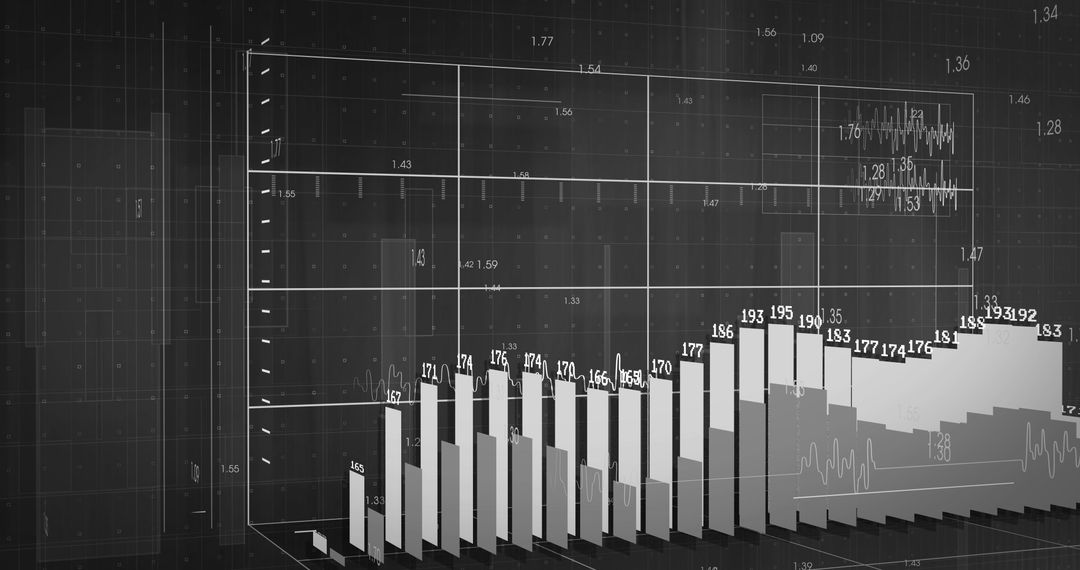
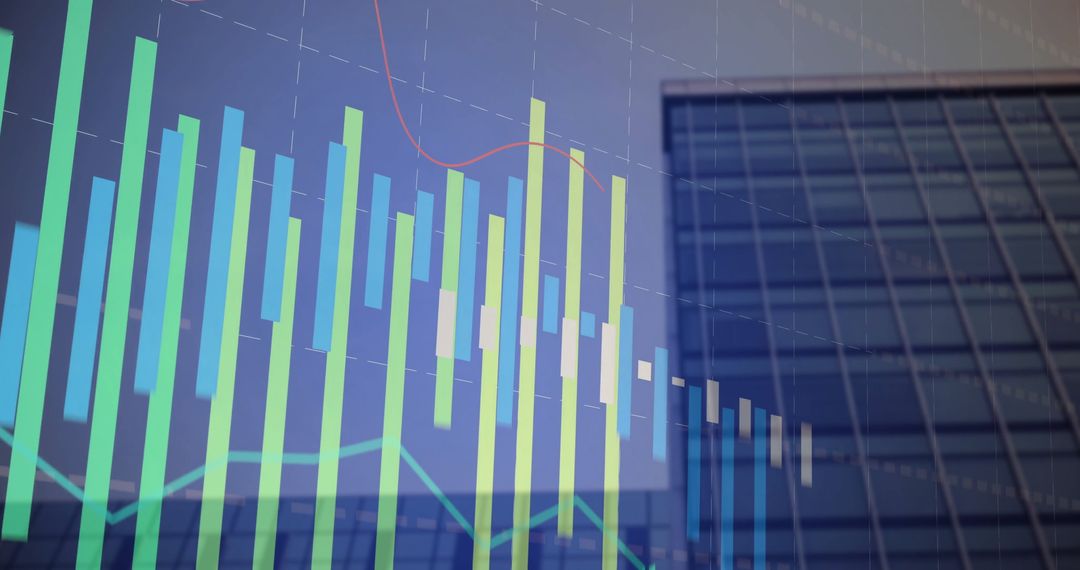
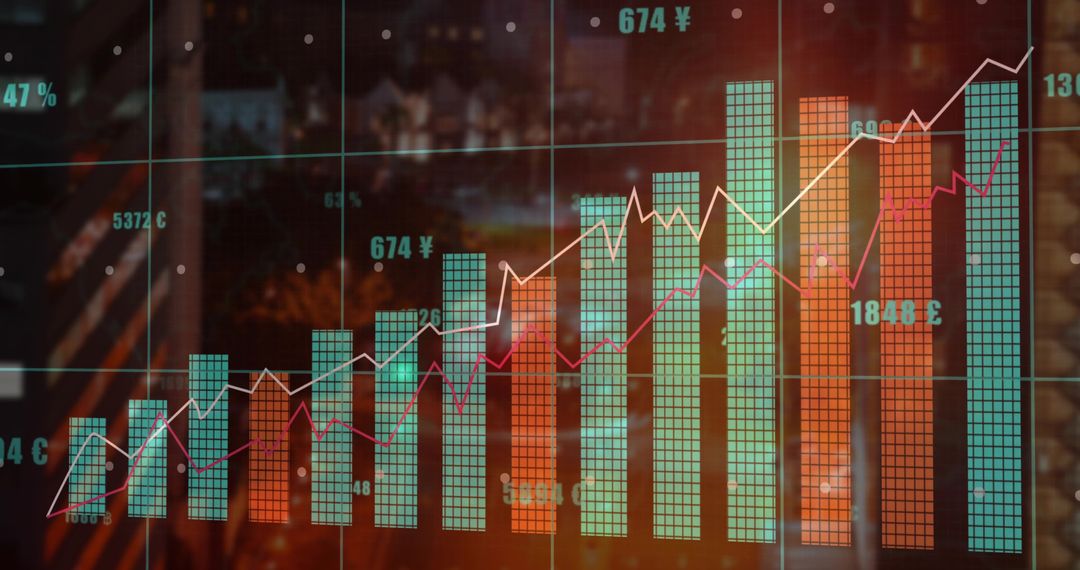
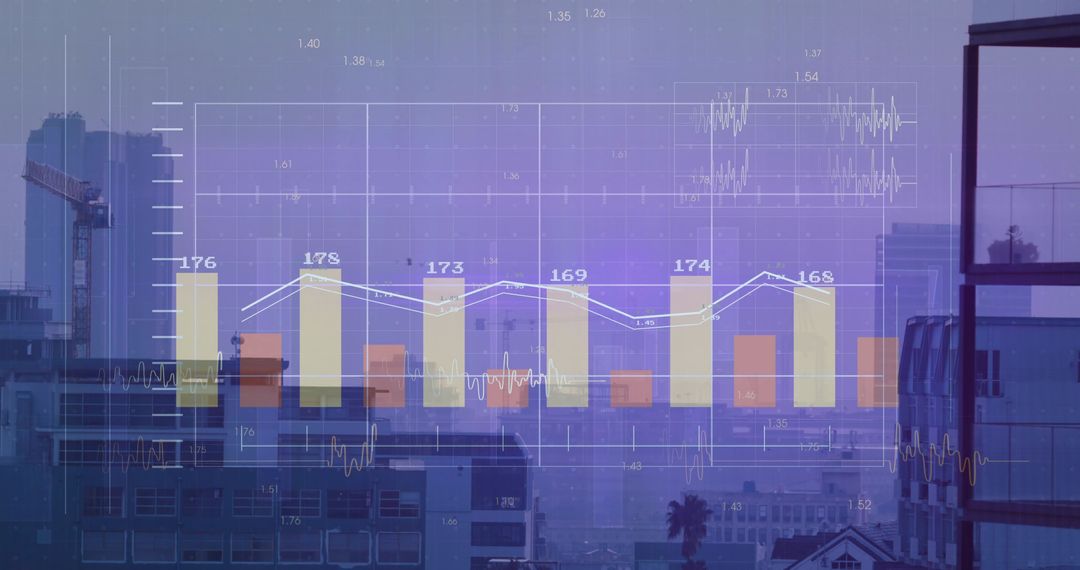
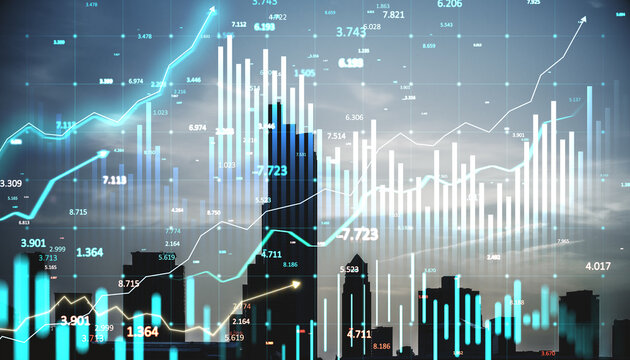
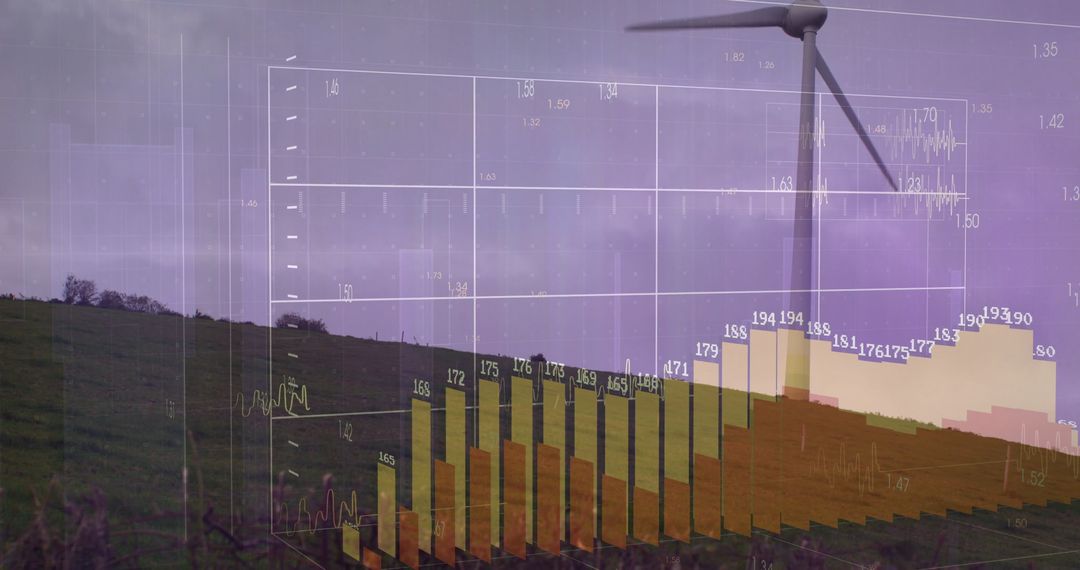
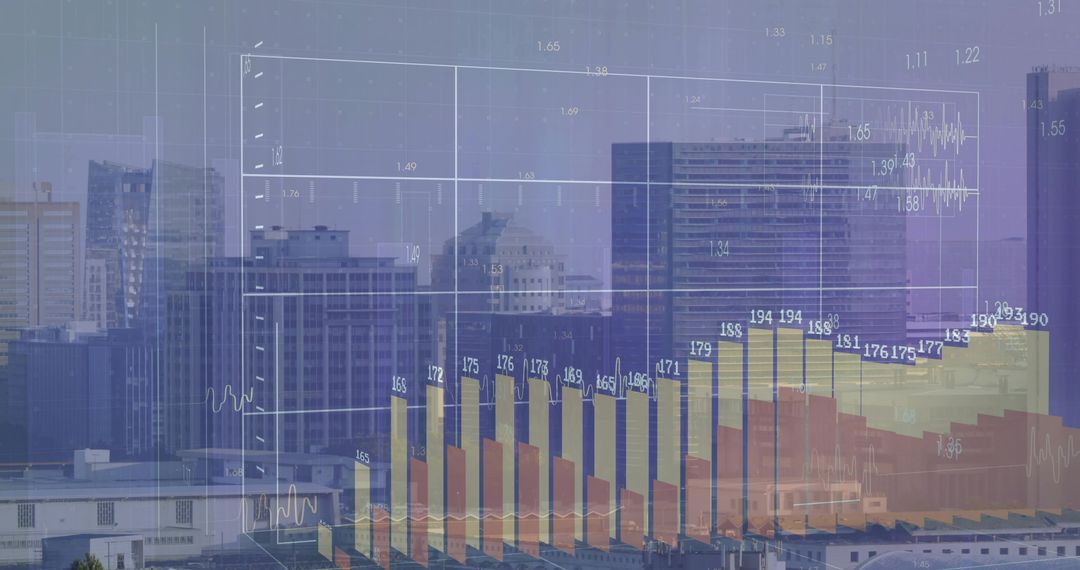
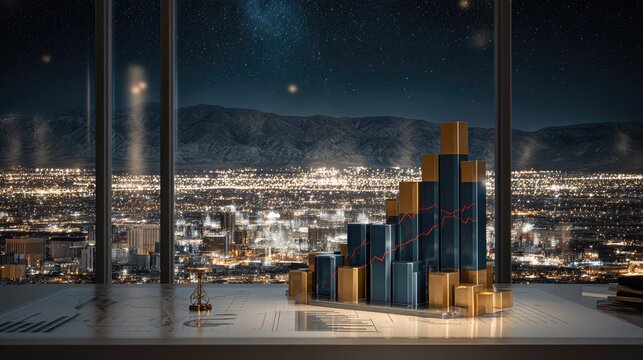
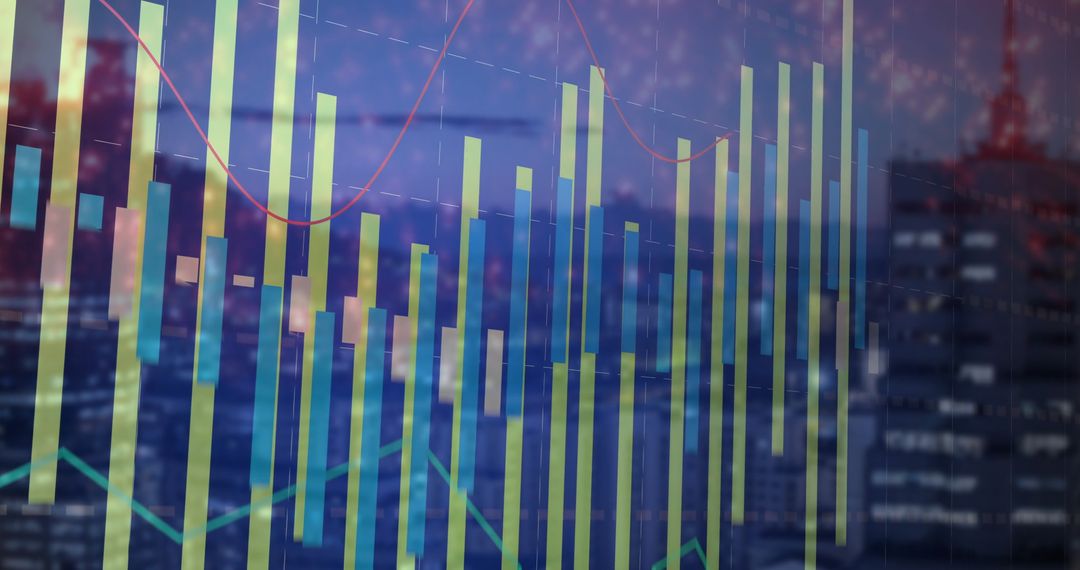
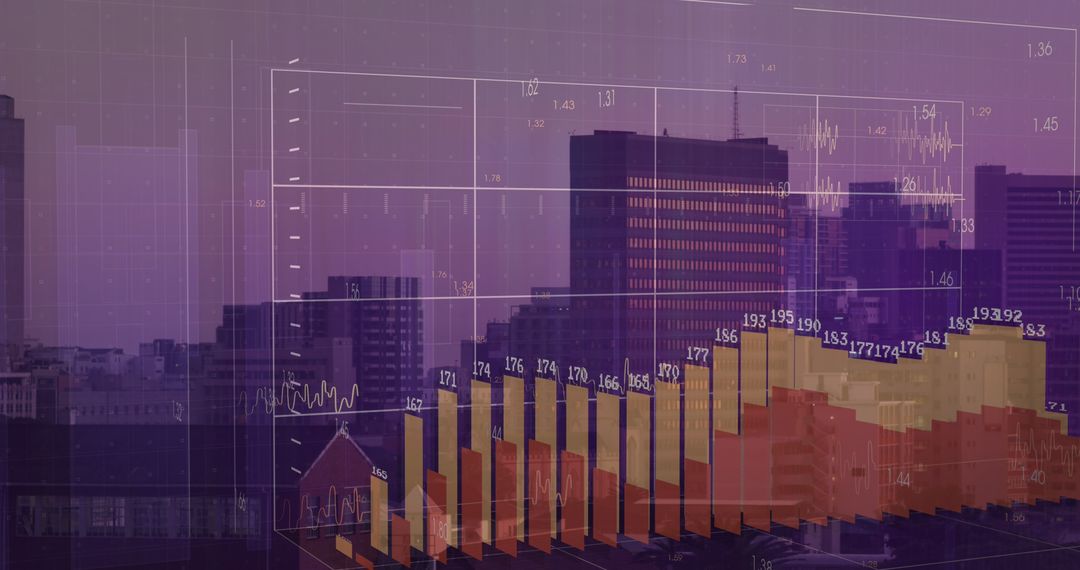
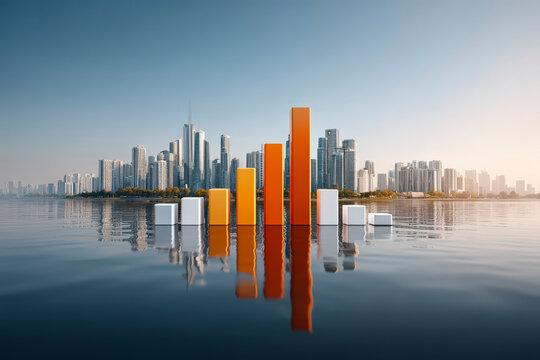
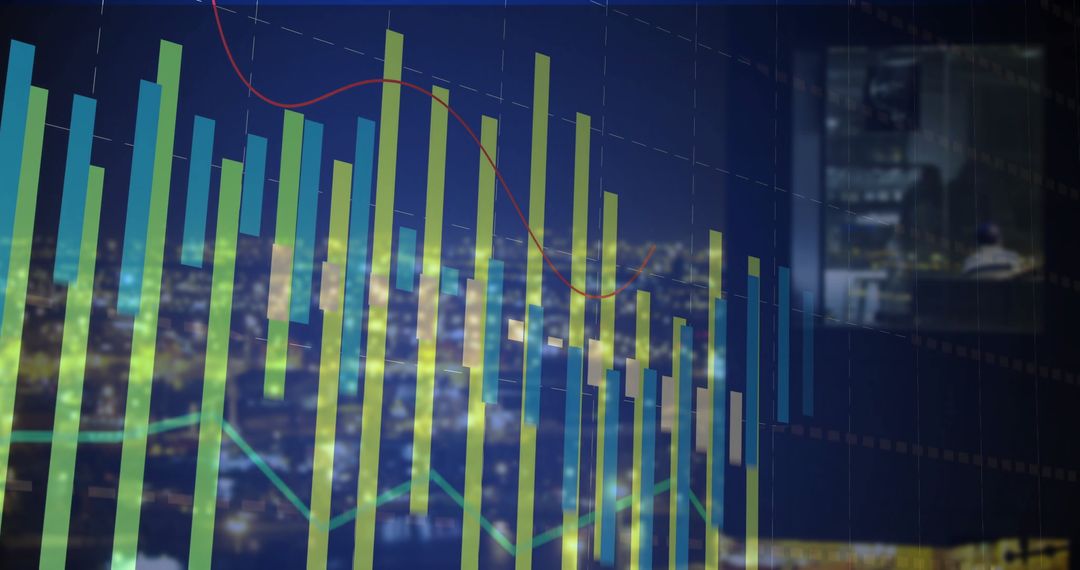
- 3D Bar Chart and Urban Skyline Blend Reflecting Modern Analytics
3D Bar Chart and Urban Skyline Blend Reflecting Modern Analytics Image
Intricate overlap of a 3D bar chart over an urban skyline illustrates a combination of technology and finance. The scene conveys themes of innovation and modern analytics, perfect for settings related to business growth, financial markets, and data-driven solutions. Use for articles by financial analysts, tech case studies, or promotional materials showcasing statistical software.
Powered by 


0
downloads
downloads
Tags:
More
Credit Photo
If you would like to credit the Photo, here are some ways you can do so
Text Link
photo Link
<span class="text-link">
<span>
<a target="_blank" href=https://pikwizard.com/photo/3d-bar-chart-and-urban-skyline-blend-reflecting-modern-analytics/7262f93702da34df761121df7fcdef13/>PikWizard</a>
</span>
</span>
<span class="image-link">
<span
style="margin: 0 0 20px 0; display: inline-block; vertical-align: middle; width: 100%;"
>
<a
target="_blank"
href="https://pikwizard.com/photo/3d-bar-chart-and-urban-skyline-blend-reflecting-modern-analytics/7262f93702da34df761121df7fcdef13/"
style="text-decoration: none; font-size: 10px; margin: 0;"
>
<img src="https://pikwizard.com/pw/medium/7262f93702da34df761121df7fcdef13.jpg" style="margin: 0; width: 100%;" alt="" />
<p style="font-size: 12px; margin: 0;">PikWizard</p>
</a>
</span>
</span>
Free (free of charge)
Free for personal and commercial use.
Author: Creative Art
Similar Free Stock Images
Premium


Premium


Premium


Premium


Premium

Premium


Premium


Premium


Premium


Premium


Premium


Premium


Premium


Premium


Premium


Premium


Premium


Premium


Premium


Premium


Premium


Premium


Premium

Premium