- Home >
- Stock Photos >
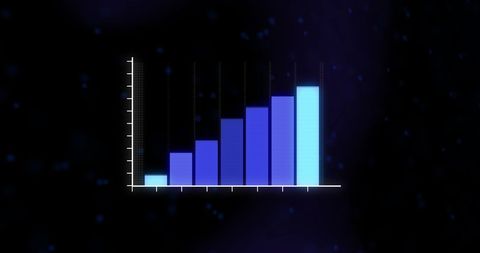
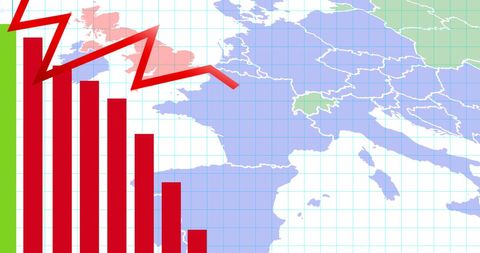
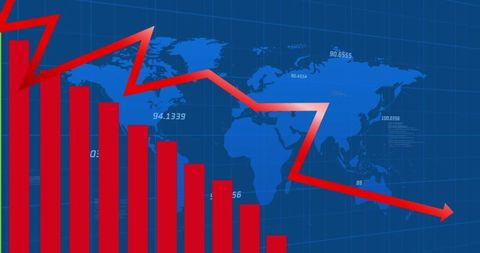
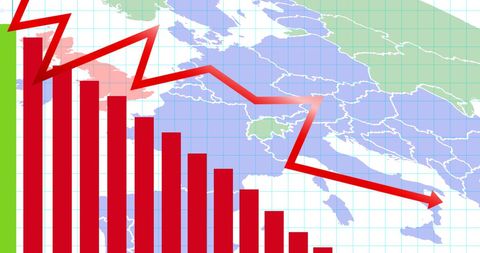
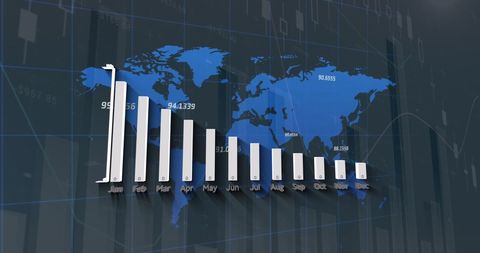
- 3D Bar Graph on World Map Illustrating Monthly Data
3D Bar Graph on World Map Illustrating Monthly Data Image
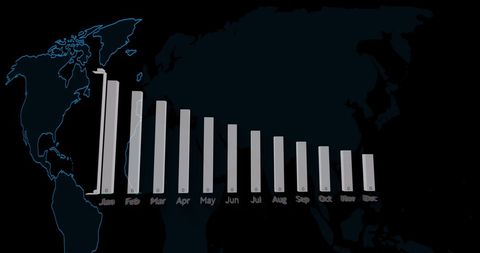
3D bar graph depicting comparative monthly data is set against a stylized world map backdrop, symbolizing global finance and business analytics. The unknown metrics vary significantly, shown proportionally for visual emphasis. Usage includes instructional materials on economic trends, financial reports, statistical blogs, and presentations in corporates explaining technological influence on data analysis.

2
downloads
downloads
Tags:
More
Credit Photo
If you would like to credit the Photo, here are some ways you can do so
Text Link
photo Link
<span class="text-link">
<span>
<a target="_blank" href=https://pikwizard.com/photo/3d-bar-graph-on-world-map-illustrating-monthly-data/6c410705b3395860f036174c8965051d/>PikWizard</a>
</span>
</span>
<span class="image-link">
<span
style="margin: 0 0 20px 0; display: inline-block; vertical-align: middle; width: 100%;"
>
<a
target="_blank"
href="https://pikwizard.com/photo/3d-bar-graph-on-world-map-illustrating-monthly-data/6c410705b3395860f036174c8965051d/"
style="text-decoration: none; font-size: 10px; margin: 0;"
>
<img src="https://pikwizard.com/pw/medium/6c410705b3395860f036174c8965051d.jpg" style="margin: 0; width: 100%;" alt="" />
<p style="font-size: 12px; margin: 0;">PikWizard</p>
</a>
</span>
</span>
Free (free of charge)
Free for personal and commercial use.
Author: Authentic Images
Similar Free Stock Images