- Home >
- Stock Photos >
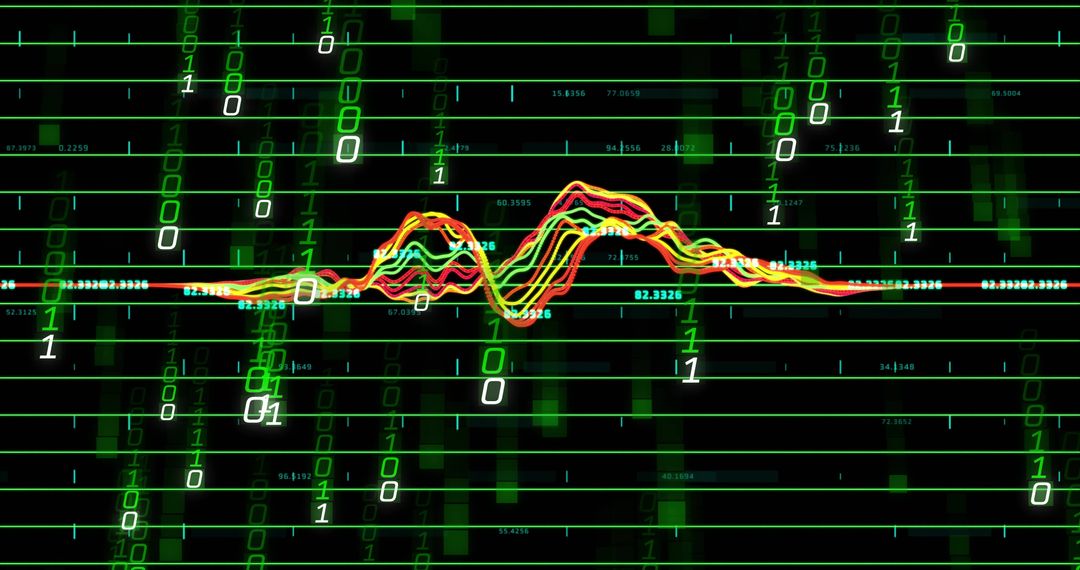
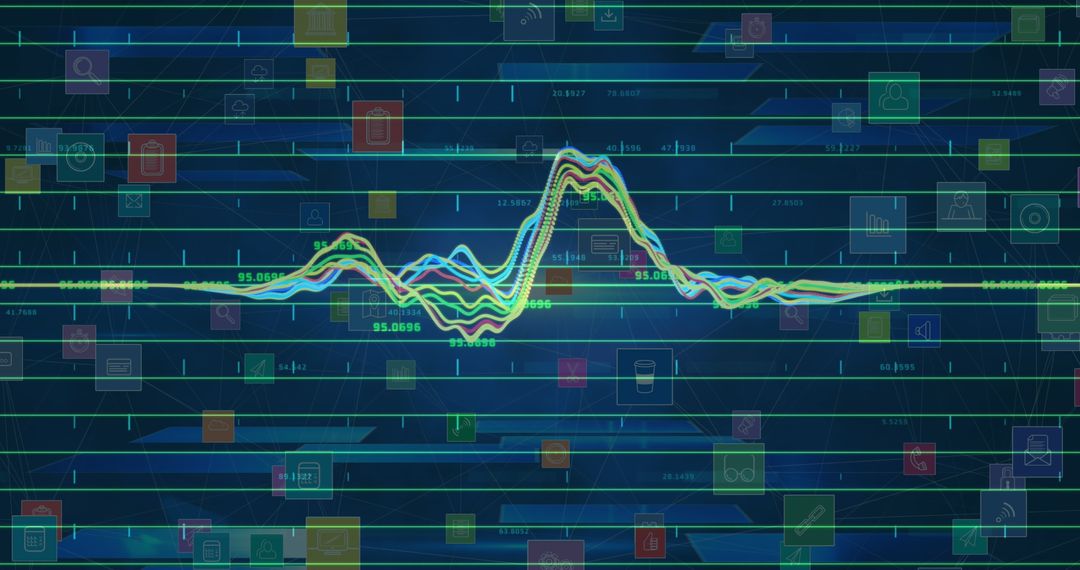
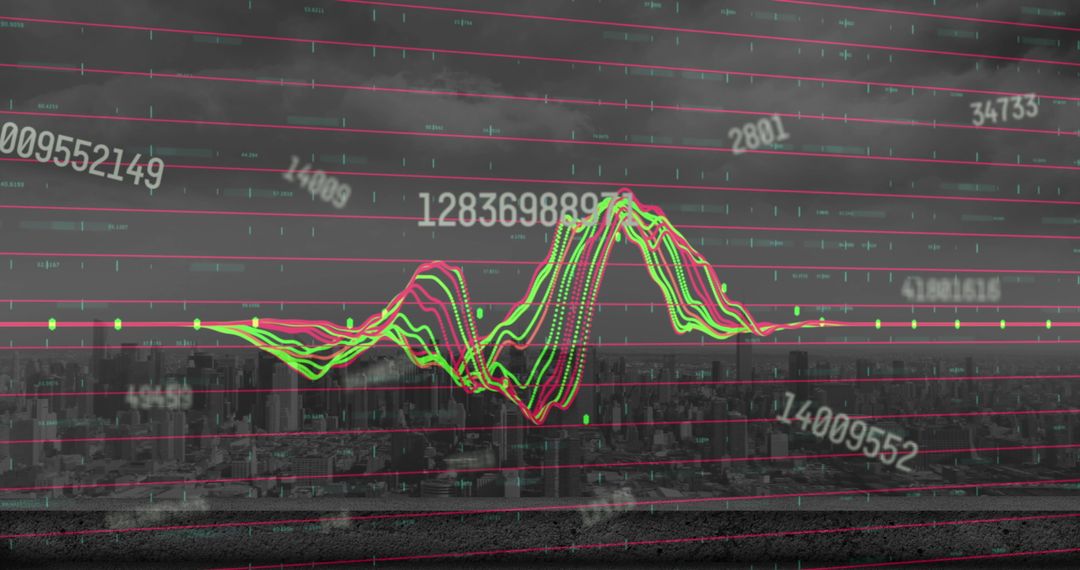
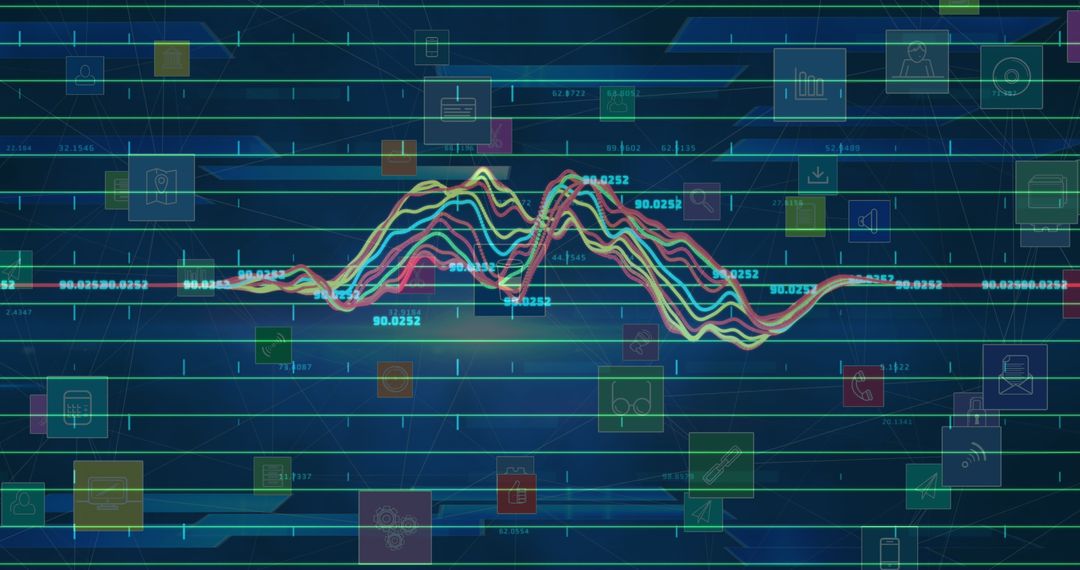
- 3D Financial Data Stream with Floating Digital Icons
3D Financial Data Stream with Floating Digital Icons Image

Digital display showcasing complex financial data streams winding across screen amid various floating digital icons. Useful for illustrating modern global economy and finance concepts, digital data processing in business contexts, or to highlight futuristic aspects of financial technology for presentations and reports.
Powered by 


2
downloads
downloads
Tags:
More
Credit Photo
If you would like to credit the Photo, here are some ways you can do so
Text Link
photo Link
<span class="text-link">
<span>
<a target="_blank" href=https://pikwizard.com/photo/3d-financial-data-stream-with-floating-digital-icons/64f18c1125ba34d204c7599a623eda0e/>PikWizard</a>
</span>
</span>
<span class="image-link">
<span
style="margin: 0 0 20px 0; display: inline-block; vertical-align: middle; width: 100%;"
>
<a
target="_blank"
href="https://pikwizard.com/photo/3d-financial-data-stream-with-floating-digital-icons/64f18c1125ba34d204c7599a623eda0e/"
style="text-decoration: none; font-size: 10px; margin: 0;"
>
<img src="https://pikwizard.com/pw/medium/64f18c1125ba34d204c7599a623eda0e.jpg" style="margin: 0; width: 100%;" alt="" />
<p style="font-size: 12px; margin: 0;">PikWizard</p>
</a>
</span>
</span>
Free (free of charge)
Free for personal and commercial use.
Author: Awesome Content
Similar Free Stock Images
Premium


Premium


Premium


Premium


Premium


Premium


Premium


Premium


Premium


Premium


Premium


Premium


Premium


Premium


Premium


Premium


Premium


Premium


Premium


Premium


Premium

Premium


Premium


Premium