
- Home >
- Stock Photos >
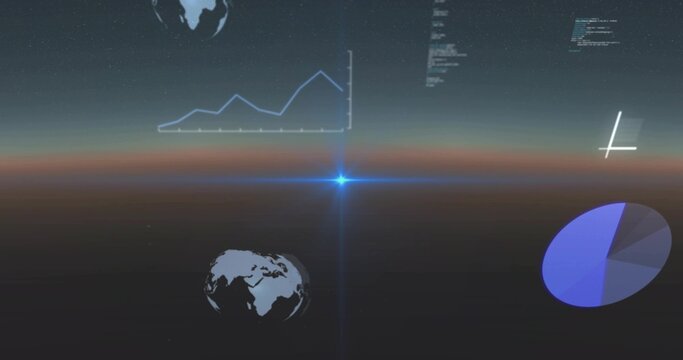
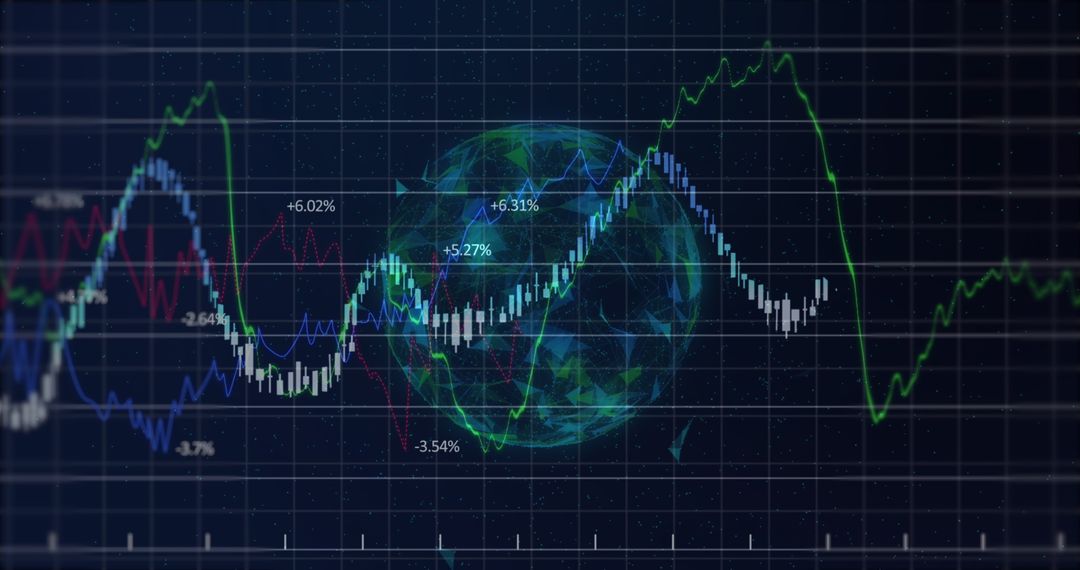
- 3D Globe with Virtual Line Chart in Neon Digital Interface
3D Globe with Virtual Line Chart in Neon Digital Interface Image

Dynamic visualization of a semi-transparent 3D globe integrated with a line chart on a virtual dashboard. Neon grid lines and cyan tones create a futuristic digital landscape, suitable for themes involving finance, big data analysis, global markets, or technology innovation. Ideal for presentations, educational materials, or websites focused on global analytics and monitoring.
Powered by 


0
downloads
downloads
Tags:
More
Credit Photo
If you would like to credit the Photo, here are some ways you can do so
Text Link
photo Link
<span class="text-link">
<span>
<a target="_blank" href=https://pikwizard.com/photo/3d-globe-with-virtual-line-chart-in-neon-digital-interface/3903d8b04737fc74526cfa982361e534/>PikWizard</a>
</span>
</span>
<span class="image-link">
<span
style="margin: 0 0 20px 0; display: inline-block; vertical-align: middle; width: 100%;"
>
<a
target="_blank"
href="https://pikwizard.com/photo/3d-globe-with-virtual-line-chart-in-neon-digital-interface/3903d8b04737fc74526cfa982361e534/"
style="text-decoration: none; font-size: 10px; margin: 0;"
>
<img src="https://pikwizard.com/pw/medium/3903d8b04737fc74526cfa982361e534.jpg" style="margin: 0; width: 100%;" alt="" />
<p style="font-size: 12px; margin: 0;">PikWizard</p>
</a>
</span>
</span>
Free (free of charge)
Free for personal and commercial use.
Author: Awesome Content
Similar Free Stock Images

Premium


Premium


Premium


Premium


Premium


Premium


Premium


Premium


Premium


Premium


Premium


Premium


Premium


Premium


Premium


Premium


Premium


Premium


Premium


Premium


Premium


Premium


Premium


Premium

