
- Home >
- Stock Photos >
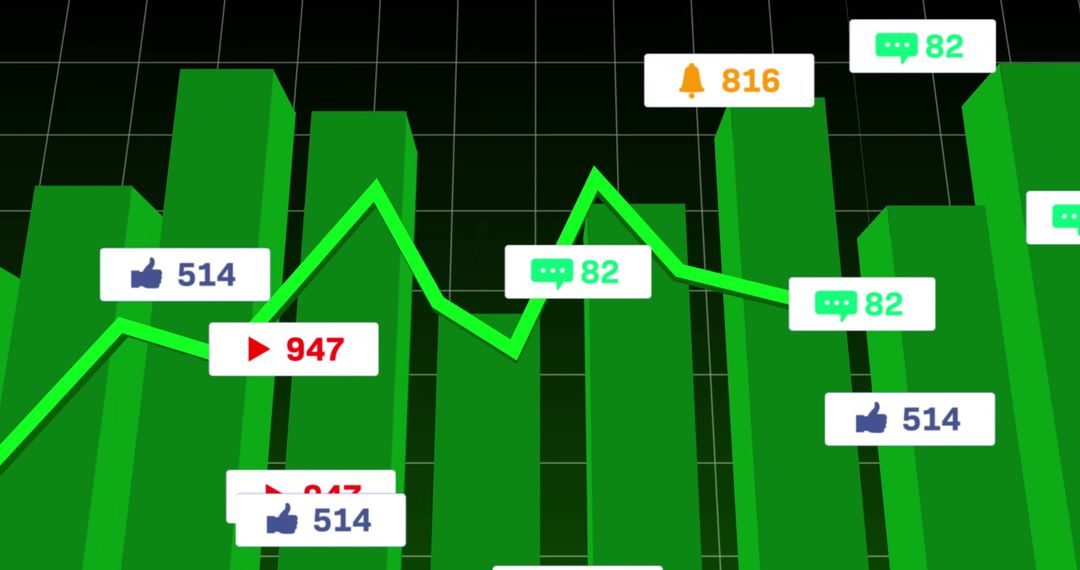
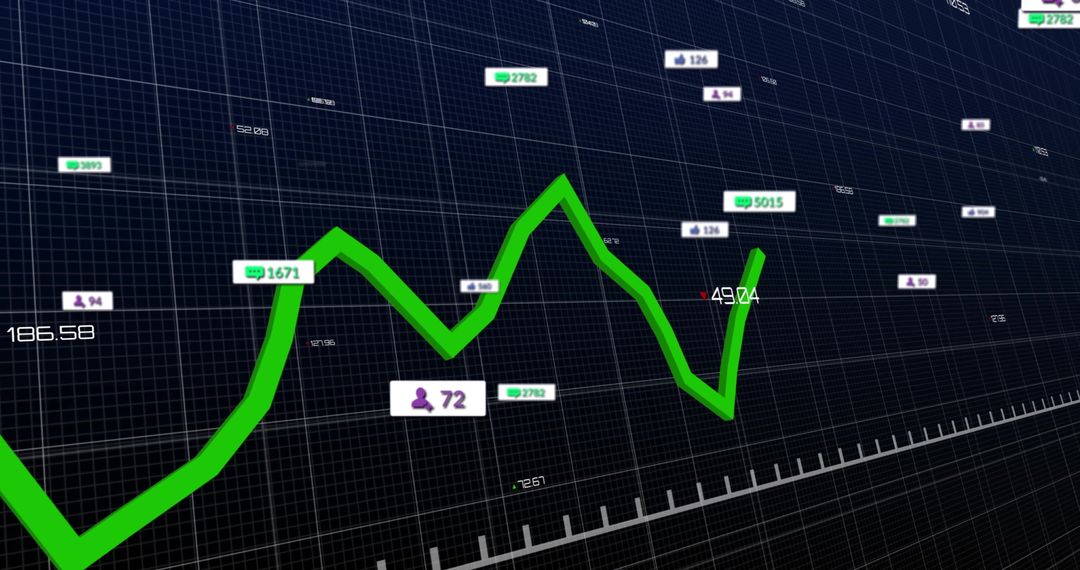
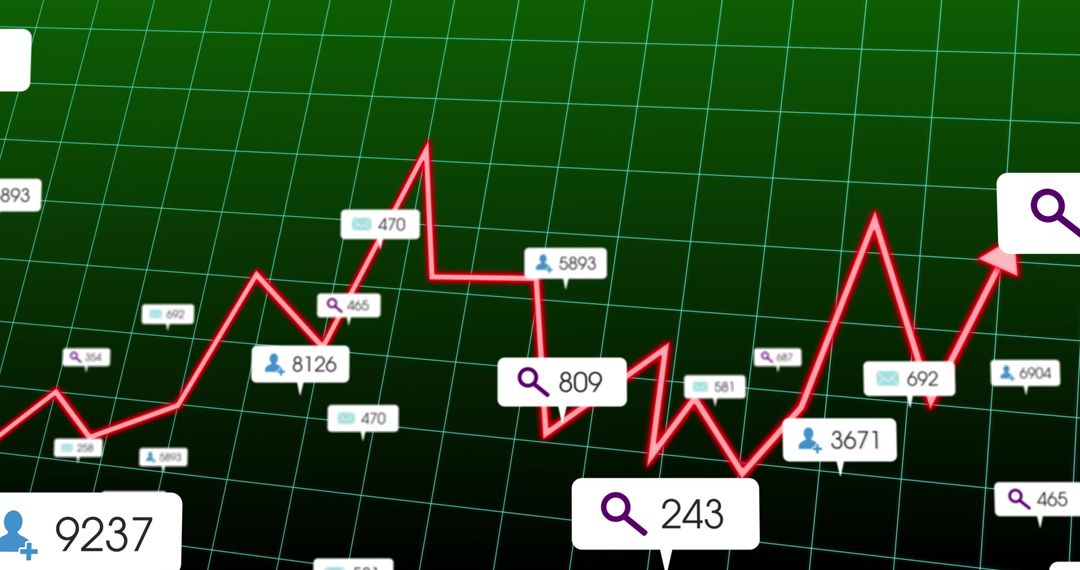
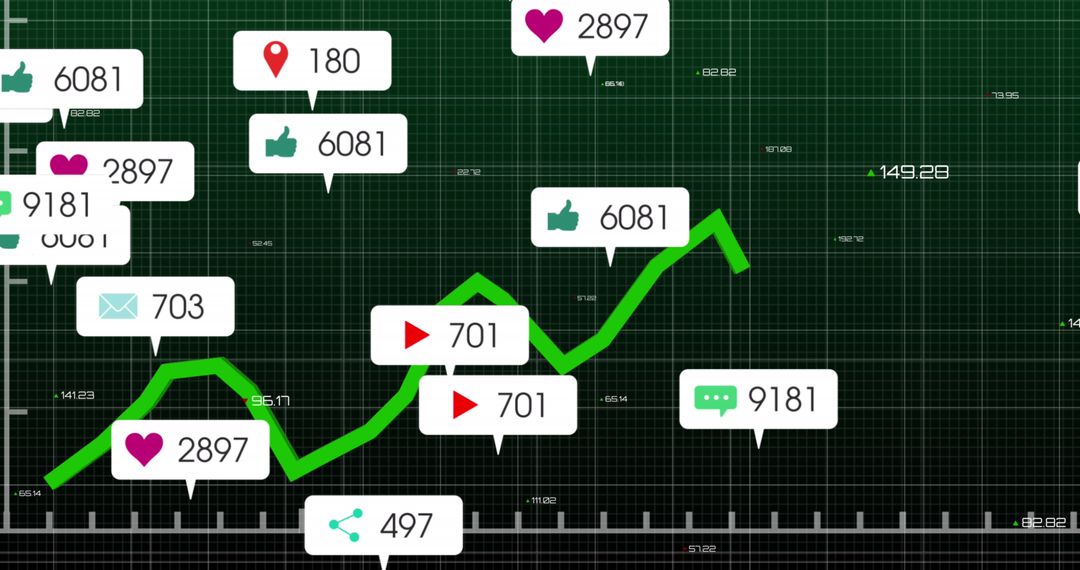
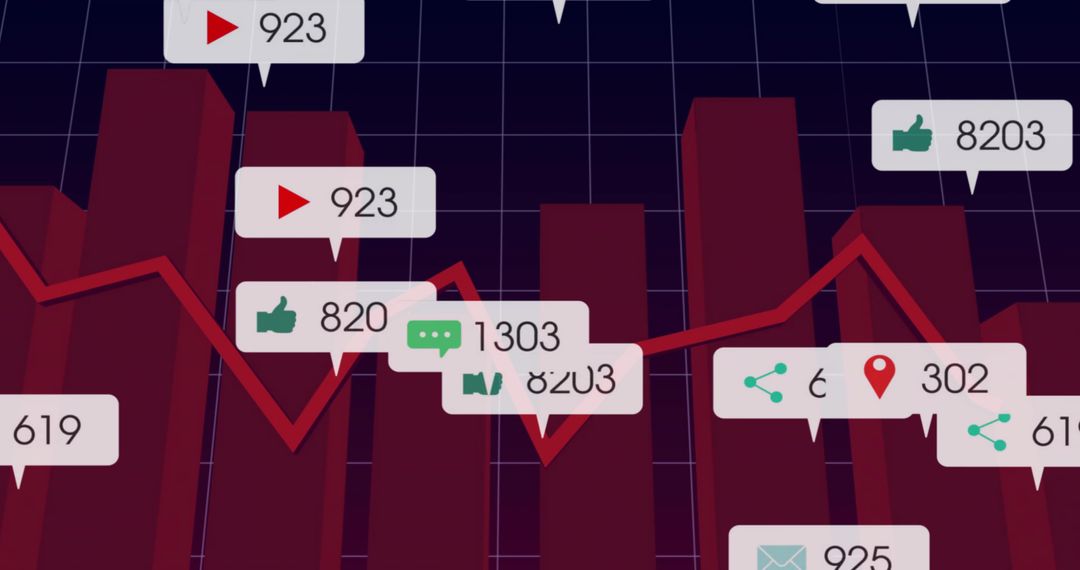
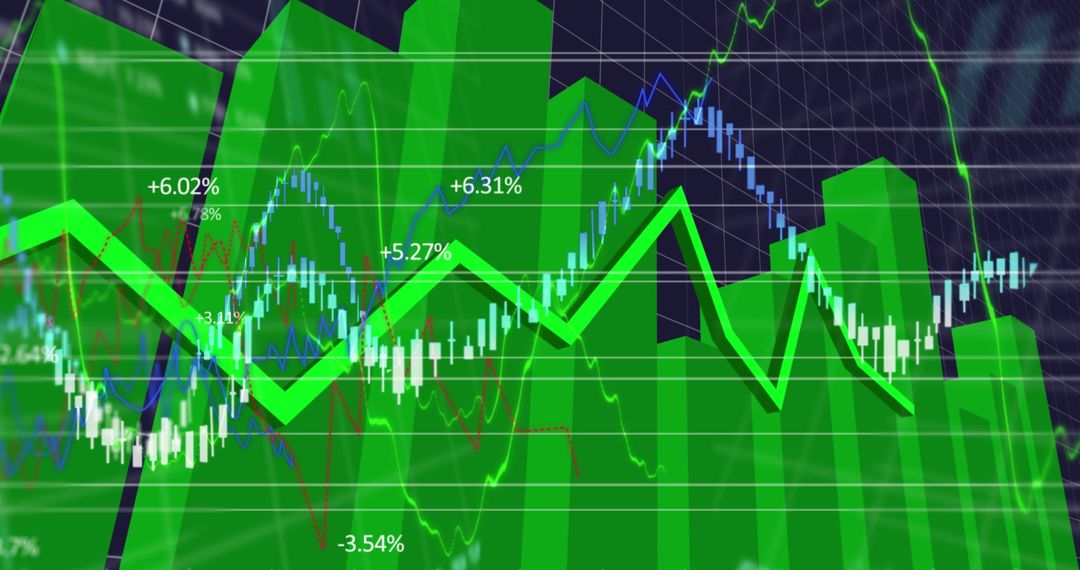
- 3D Green Bar Chart with Bright Line Tracking and Interactive Callouts on Dark Grid Dashboard
3D Green Bar Chart with Bright Line Tracking and Interactive Callouts on Dark Grid Dashboard Image
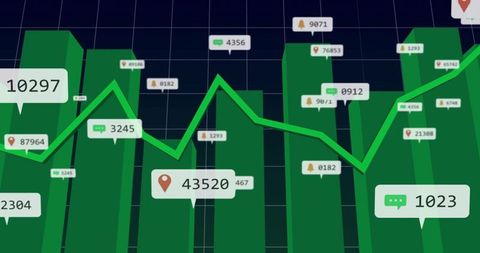
High-contrast 3D business dashboard showing stacked green vertical bars with bright green line tracking across dark grid, with floating callouts containing numeric labels, chat icons, and location pins. Composition emphasizing depth and perspective, conveying dynamic trend movement and dense data points. Color palette and strong contrast creating clear visual hierarchy for fast metric reading. Supporting business presentations, financial reports, investor decks, product landing pages, analytics blog headers, UI mockups for dashboard apps, marketing collateral for fintech and SaaS brands, and educational materials about data literacy. Useful for illustrating KPI tracking, growth analysis, performance comparison, real-time monitoring, and user engagement metrics; suitable for hero graphics, slide backgrounds, web banners, and editorial layouts.
Powered by  - Get 15% off with code: PIKWIZARD15


0
downloads
downloads
Tags:
More
Credit Photo
If you would like to credit the Photo, here are some ways you can do so
Text Link
photo Link
<span class="text-link">
<span>
<a target="_blank" href=https://pikwizard.com/photo/3d-green-bar-chart-with-bright-line-tracking-and-interactive-callouts-on-dark-grid-dashboard/c2426f1f12e1b8458e8a5346f7b55d75/>PikWizard</a>
</span>
</span>
<span class="image-link">
<span
style="margin: 0 0 20px 0; display: inline-block; vertical-align: middle; width: 100%;"
>
<a
target="_blank"
href="https://pikwizard.com/photo/3d-green-bar-chart-with-bright-line-tracking-and-interactive-callouts-on-dark-grid-dashboard/c2426f1f12e1b8458e8a5346f7b55d75/"
style="text-decoration: none; font-size: 10px; margin: 0;"
>
<img src="https://pikwizard.com/pw/medium/c2426f1f12e1b8458e8a5346f7b55d75.jpg" style="margin: 0; width: 100%;" alt="" />
<p style="font-size: 12px; margin: 0;">PikWizard</p>
</a>
</span>
</span>
Free (free of charge)
Free for personal and commercial use.
Author: Authentic Images
Similar Free Stock Images

Premium


Premium


Premium


Premium


Premium


Premium


Premium


Premium


Premium


Premium


Premium


Premium


Premium


Premium


Premium


Premium


Premium


Premium


Premium


Premium


Premium


Premium


Premium


Premium


Premium

