- Home >
- Stock Photos >
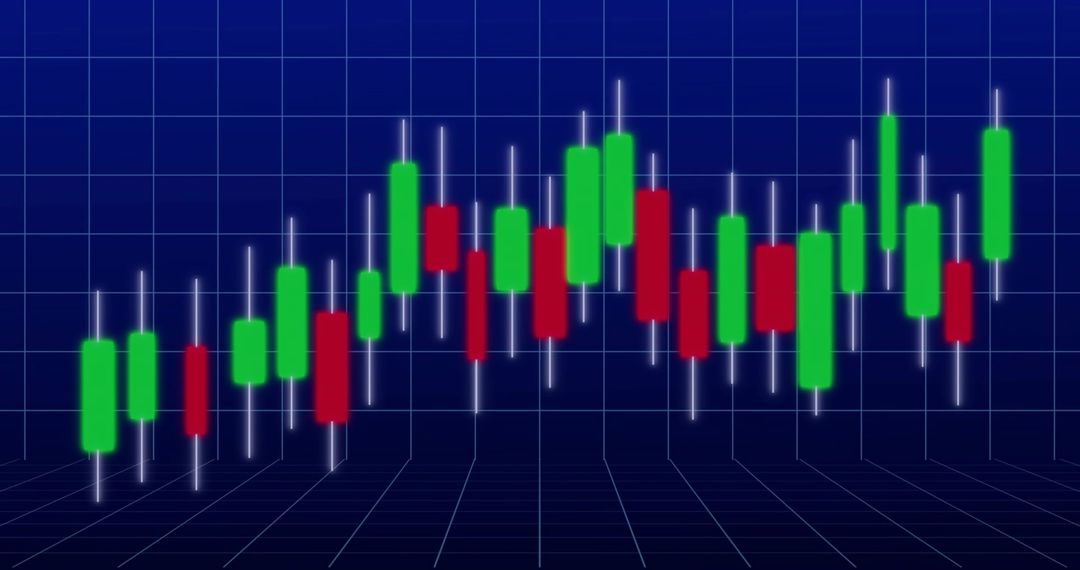
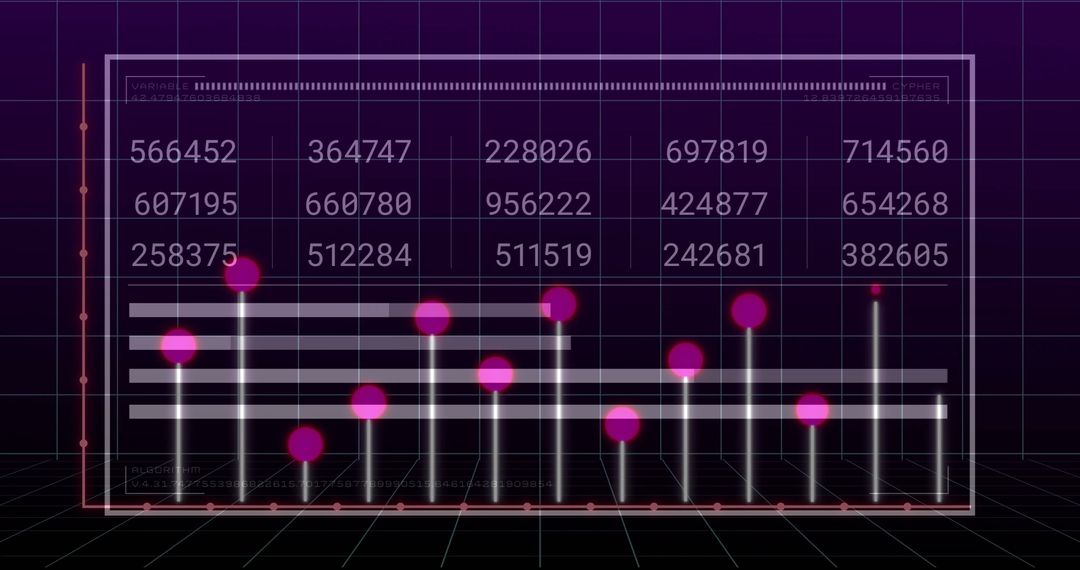
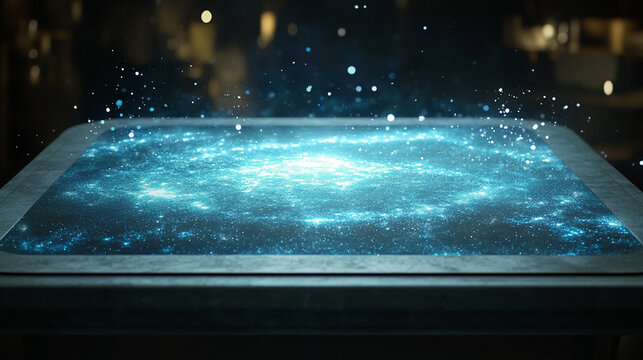
- 3D Holographic Chart on Futuristic Virtual Display
3D Holographic Chart on Futuristic Virtual Display Image

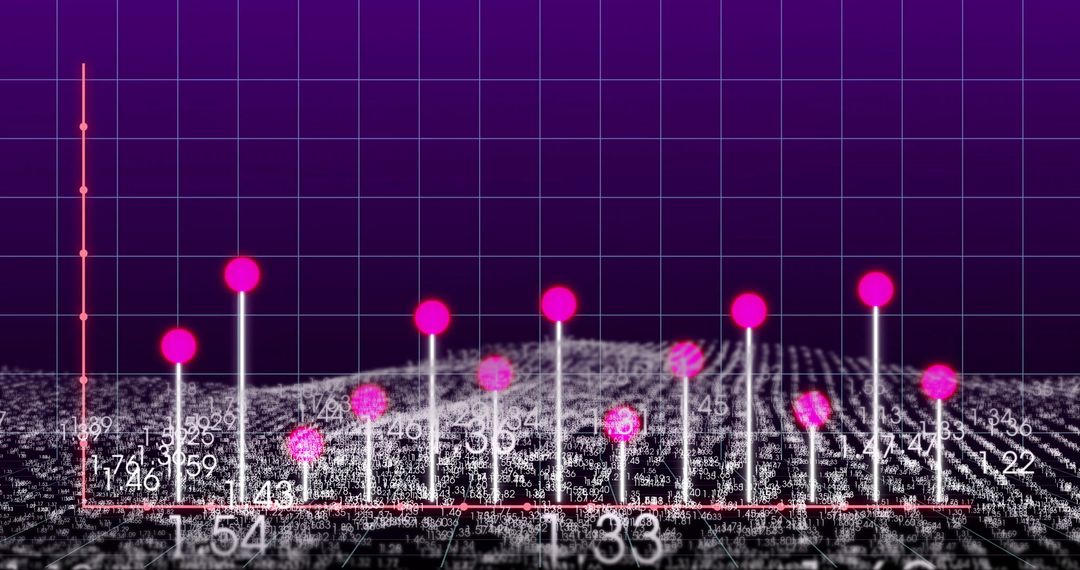
Futuristic 3D chart projected in a virtual display setting, featuring neon colors, glowing axis, and distinctive pink data points. Excellent illustration for articles or presentations related to digital innovation, future technology, immersive data visualization, and analytics. Ideal choice for backgrounds in technology conferences, digital media, or educational purposes on advanced data representation.
Powered by 


0
downloads
downloads
Tags:
More
Credit Photo
If you would like to credit the Photo, here are some ways you can do so
Text Link
photo Link
<span class="text-link">
<span>
<a target="_blank" href=https://pikwizard.com/photo/3d-holographic-chart-on-futuristic-virtual-display/2016e26d41811329ad05c6cfb74c1467/>PikWizard</a>
</span>
</span>
<span class="image-link">
<span
style="margin: 0 0 20px 0; display: inline-block; vertical-align: middle; width: 100%;"
>
<a
target="_blank"
href="https://pikwizard.com/photo/3d-holographic-chart-on-futuristic-virtual-display/2016e26d41811329ad05c6cfb74c1467/"
style="text-decoration: none; font-size: 10px; margin: 0;"
>
<img src="https://pikwizard.com/pw/medium/2016e26d41811329ad05c6cfb74c1467.jpg" style="margin: 0; width: 100%;" alt="" />
<p style="font-size: 12px; margin: 0;">PikWizard</p>
</a>
</span>
</span>
Free (free of charge)
Free for personal and commercial use.
Author: People Creations
Similar Free Stock Images

Premium


Premium


Premium


Premium


Premium


Premium


Premium


Premium


Premium


Premium


Premium


Premium


Premium


Premium


Premium


Premium


Premium


Premium


Premium


Premium


Premium


Premium


Premium


Premium