- Home >
- Stock Photos >
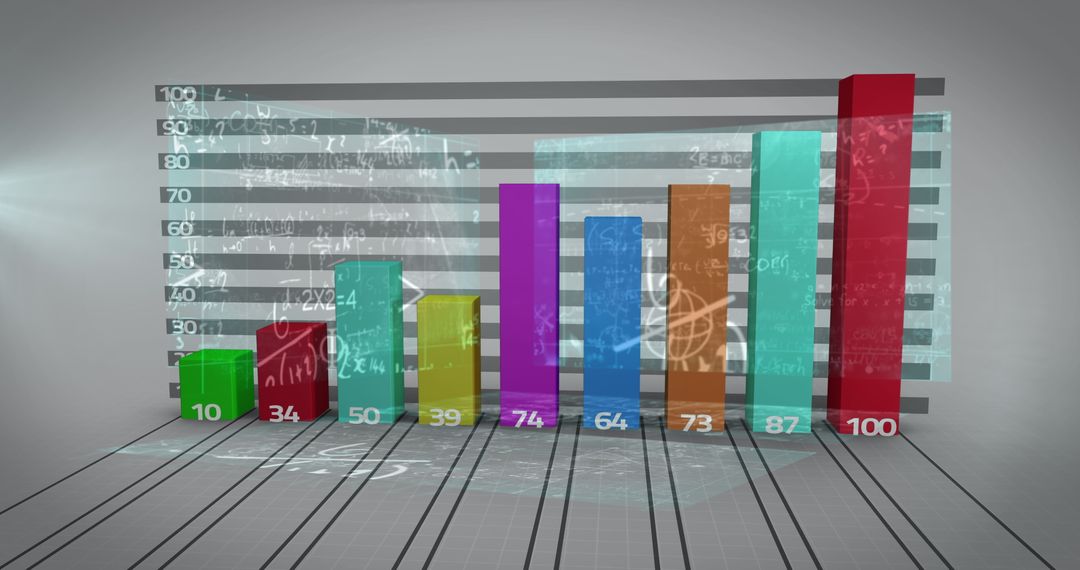
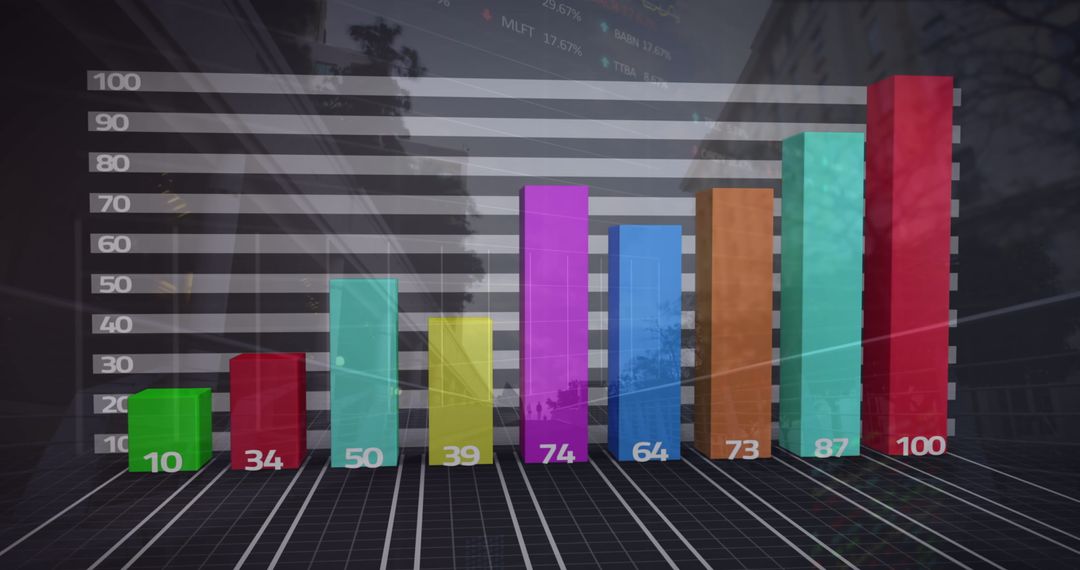
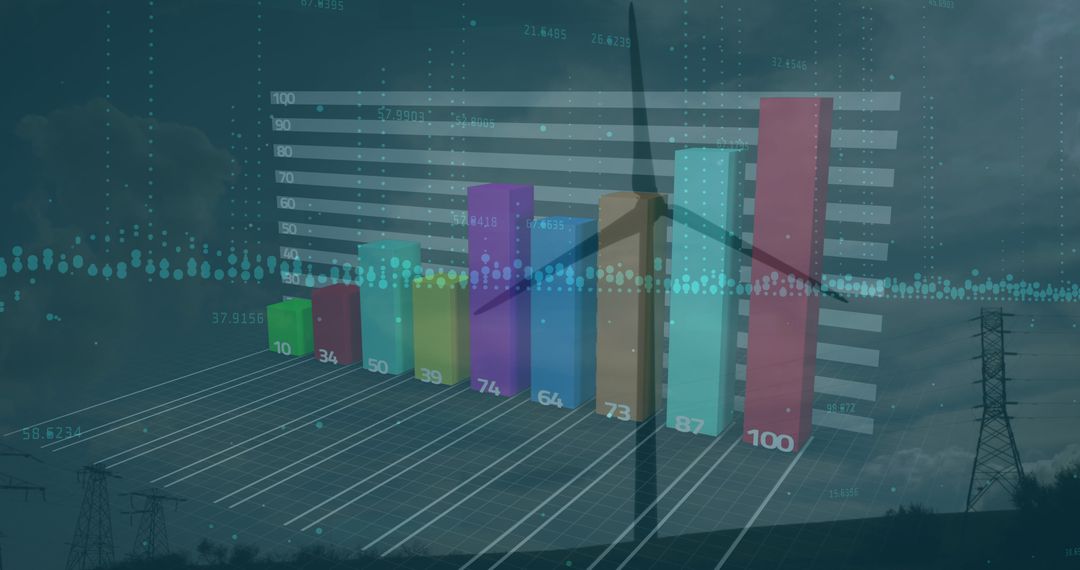
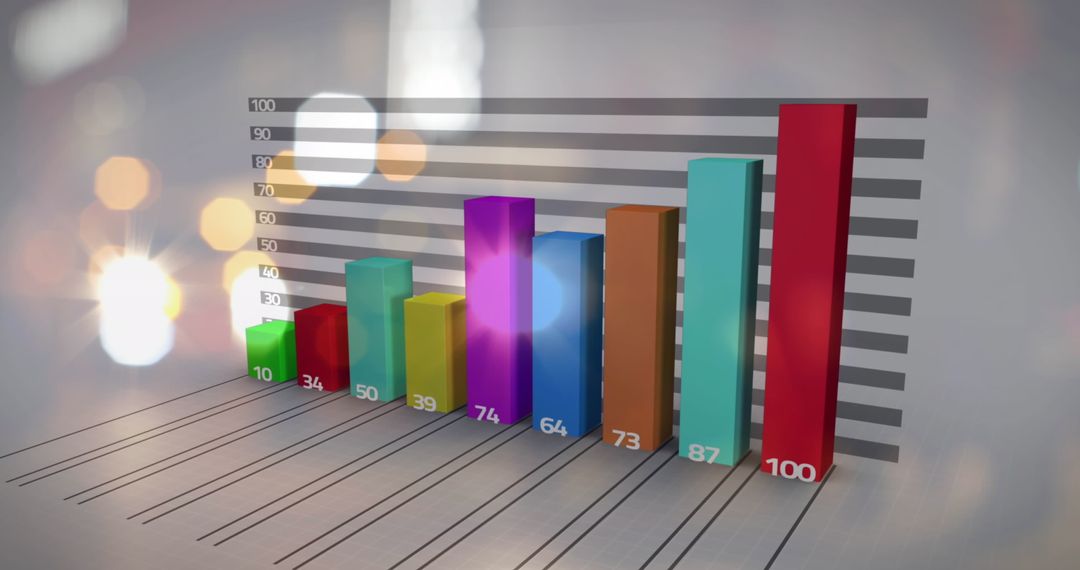
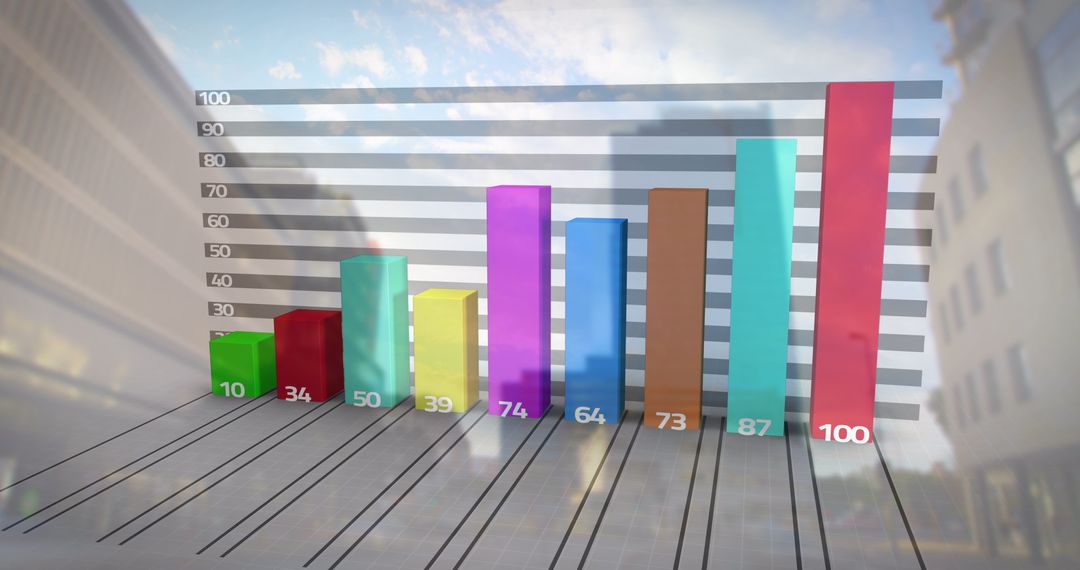
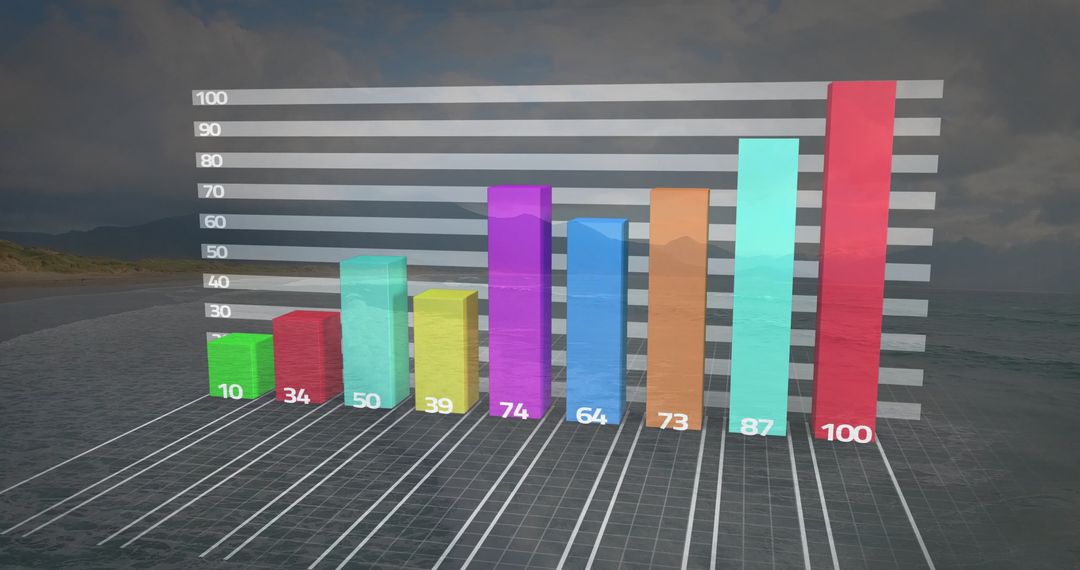
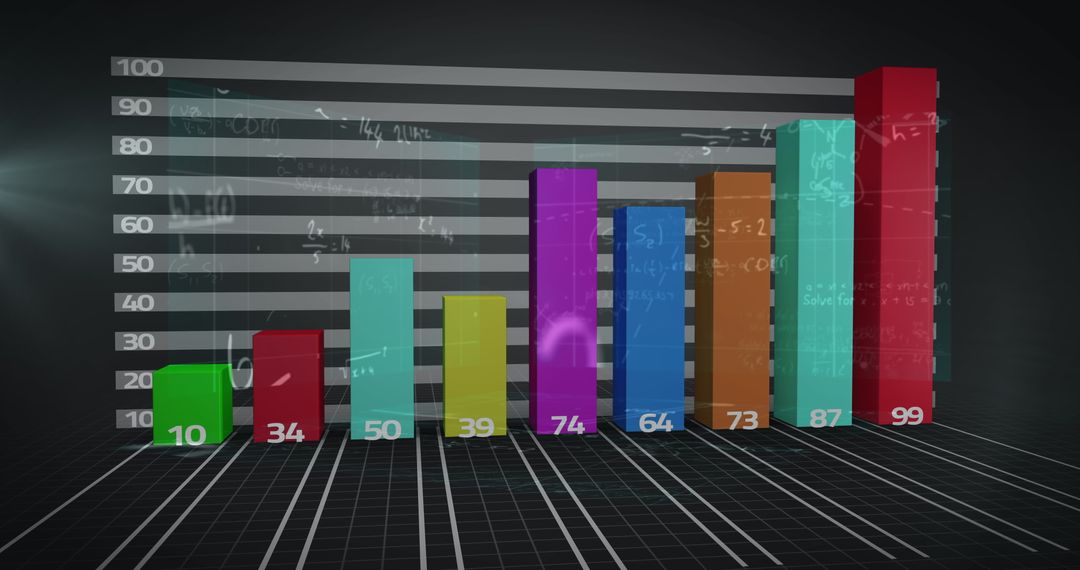
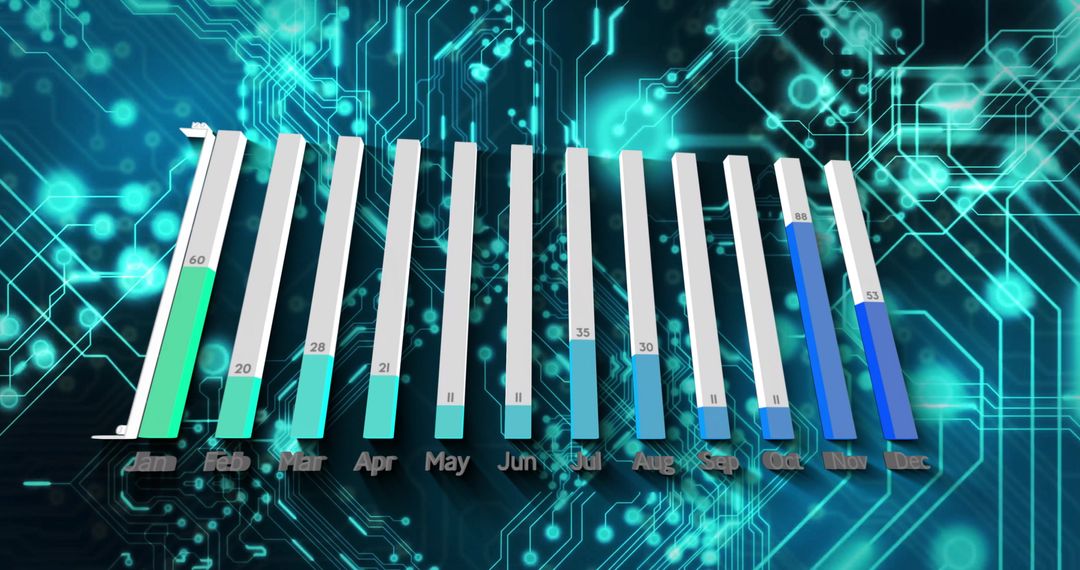
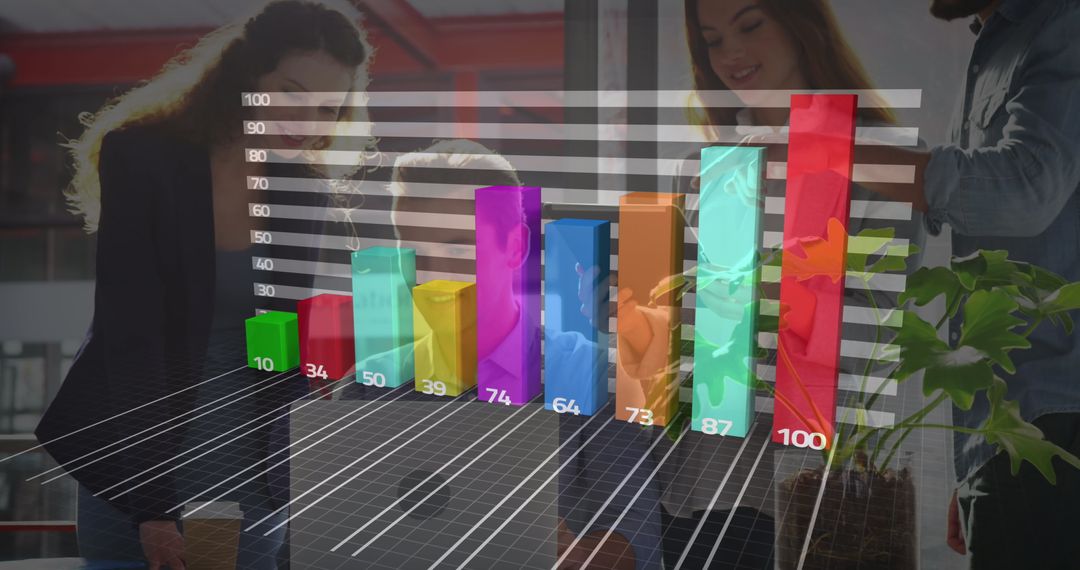
- 3D Illustrated Bar Graph with Data Analysis Icons and Connections
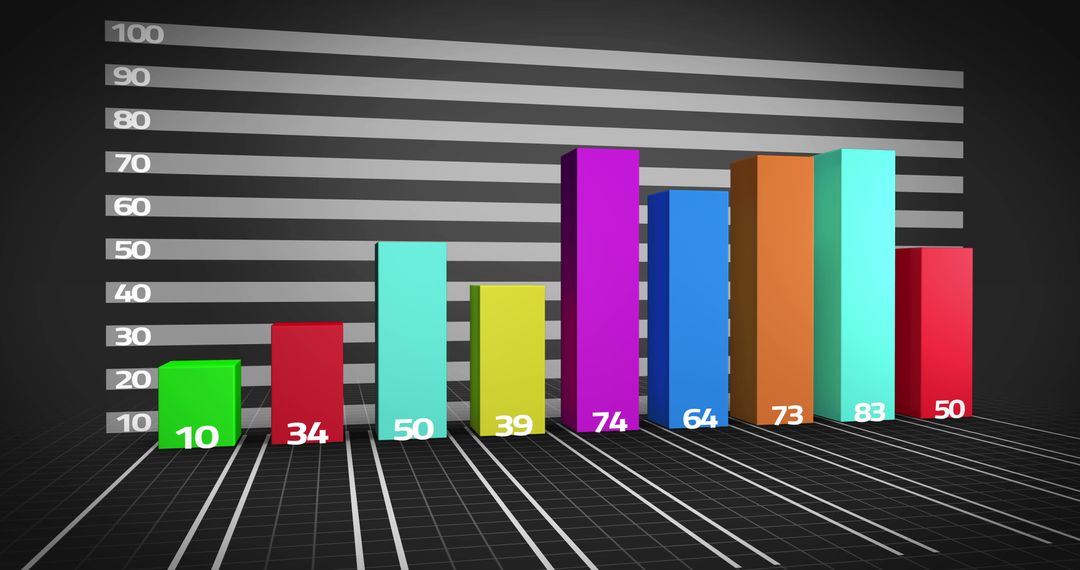
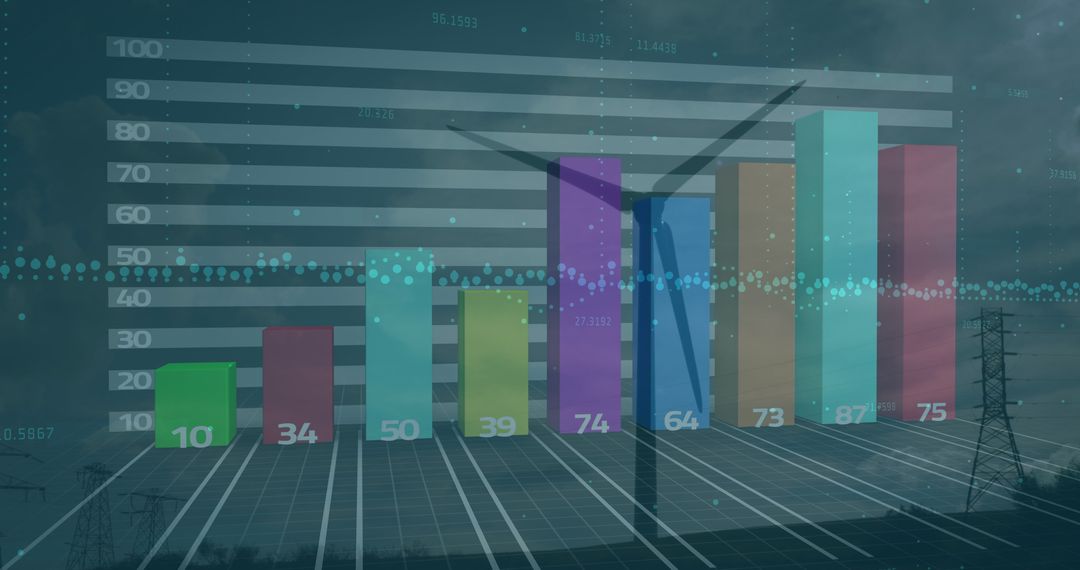
3D Illustrated Bar Graph with Data Analysis Icons and Connections Image
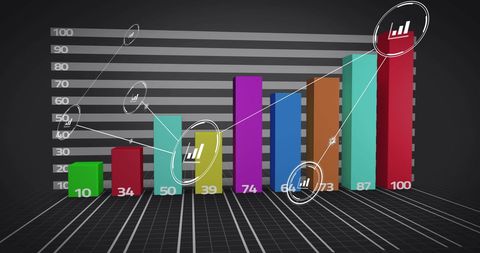
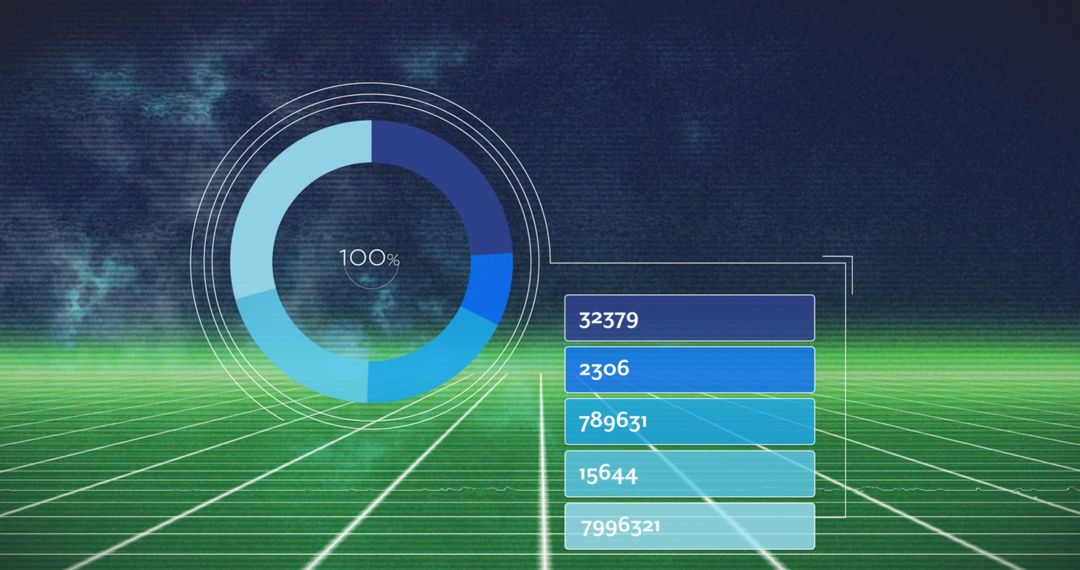
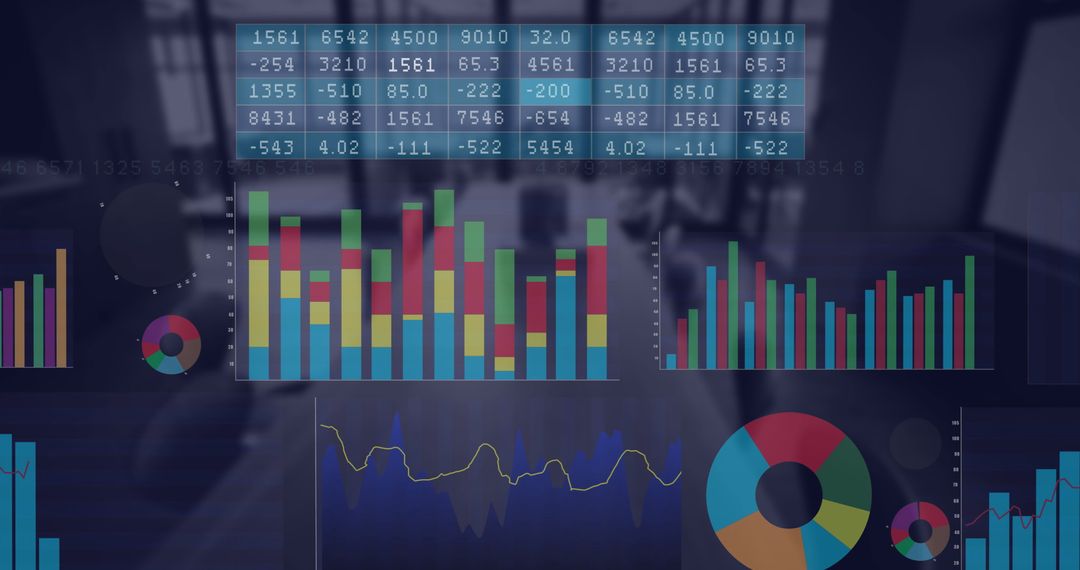
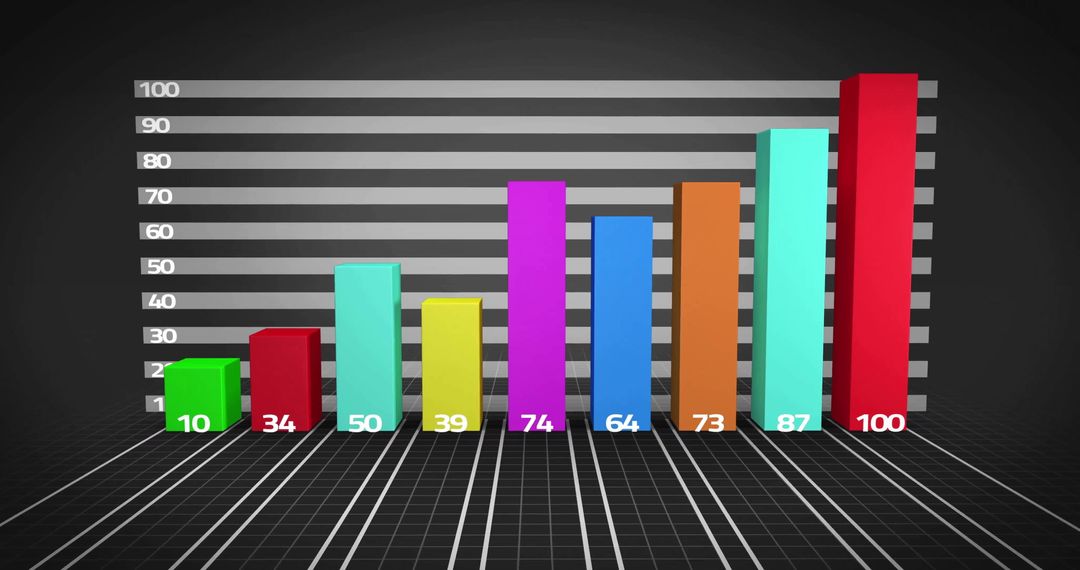
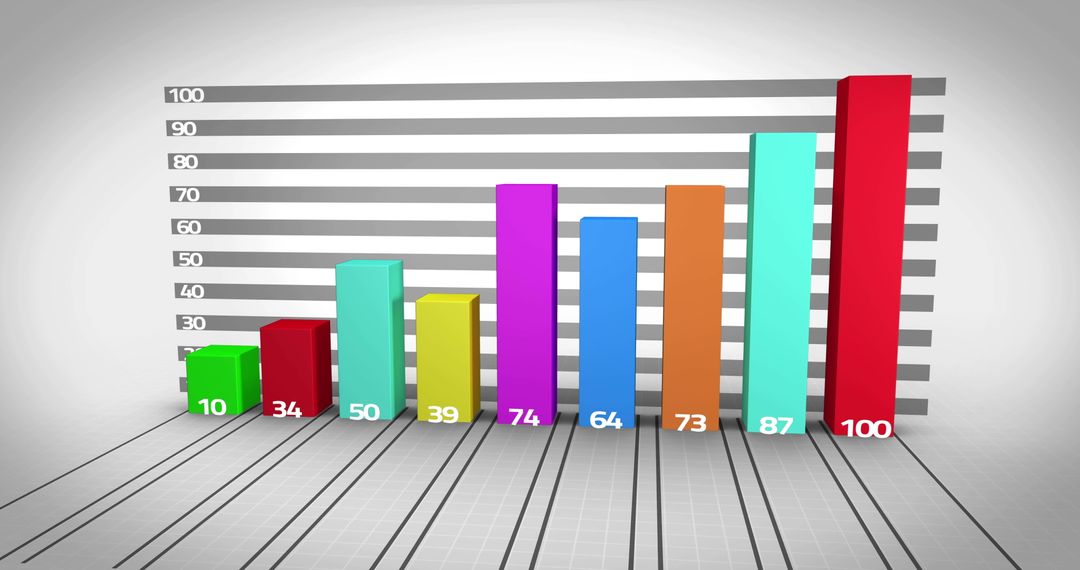
This image showcases a vibrant, 3D illustrated bar graph enhanced with data analytics icons and visible network connections. Each bar displays a different value, contributing to an overarching financial analysis theme. Perfect for illustrating concepts in business intelligence, data analysis, financial presentations, or digital transformation blogs. Emphasizes ideas of interconnectivity and modern analysis techniques.
Powered by 


0
downloads
downloads
Tags:
More
Credit Photo
If you would like to credit the Photo, here are some ways you can do so
Text Link
photo Link
<span class="text-link">
<span>
<a target="_blank" href=https://pikwizard.com/photo/3d-illustrated-bar-graph-with-data-analysis-icons-and-connections/d72700f9adae4b537bb3d5e977cc2dea/>PikWizard</a>
</span>
</span>
<span class="image-link">
<span
style="margin: 0 0 20px 0; display: inline-block; vertical-align: middle; width: 100%;"
>
<a
target="_blank"
href="https://pikwizard.com/photo/3d-illustrated-bar-graph-with-data-analysis-icons-and-connections/d72700f9adae4b537bb3d5e977cc2dea/"
style="text-decoration: none; font-size: 10px; margin: 0;"
>
<img src="https://pikwizard.com/pw/medium/d72700f9adae4b537bb3d5e977cc2dea.jpg" style="margin: 0; width: 100%;" alt="" />
<p style="font-size: 12px; margin: 0;">PikWizard</p>
</a>
</span>
</span>
Free (free of charge)
Free for personal and commercial use.
Author: Awesome Content
Similar Free Stock Images

Premium


Premium


Premium


Premium


Premium


Premium


Premium


Premium


Premium


Premium


Premium


Premium


Premium


Premium


Premium


Premium


Premium


Premium


Premium


Premium


Premium


Premium


Premium


Premium