- Home >
- Stock Photos >
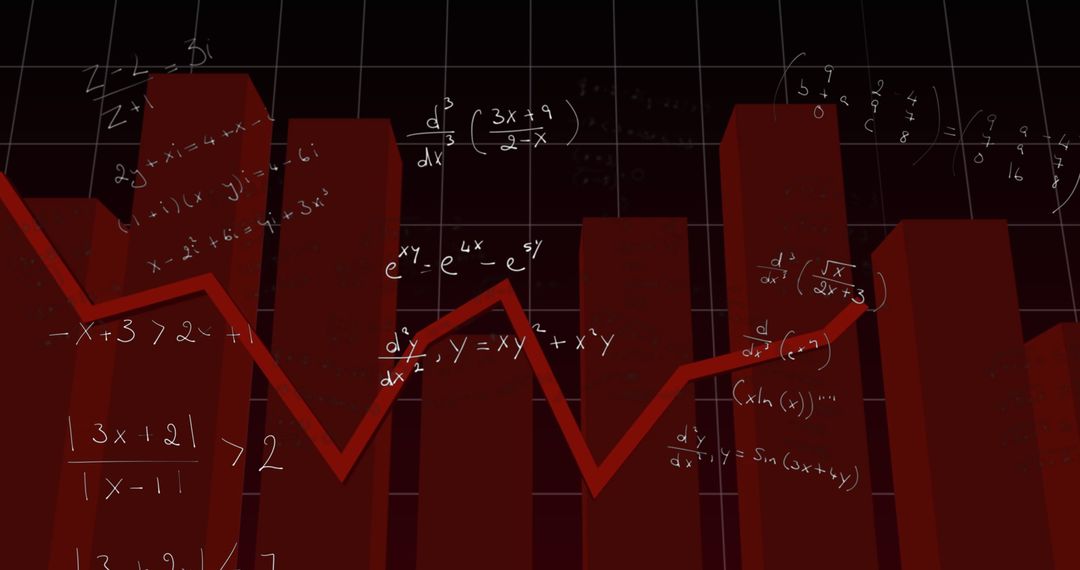
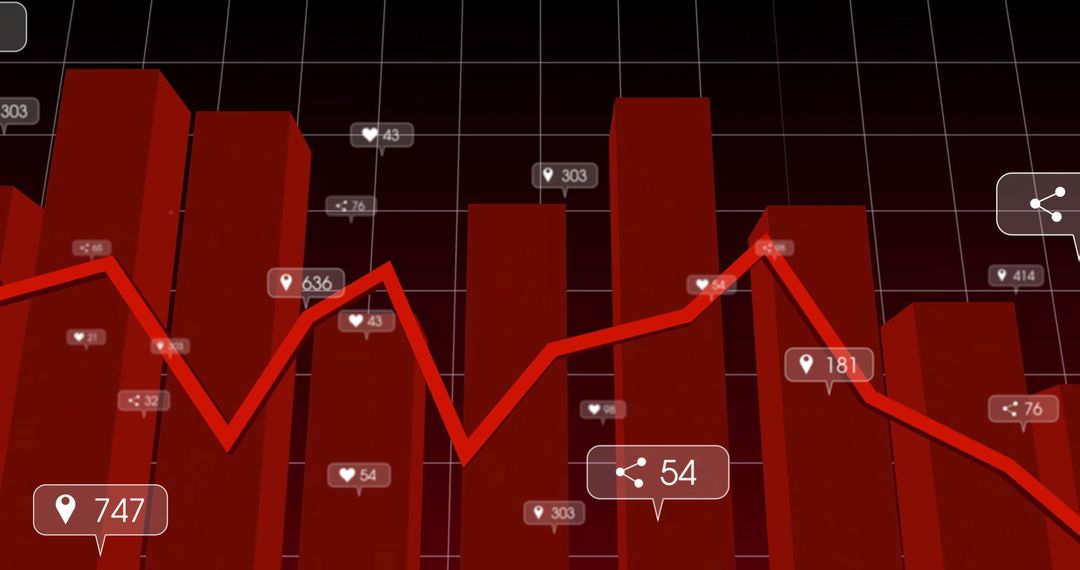
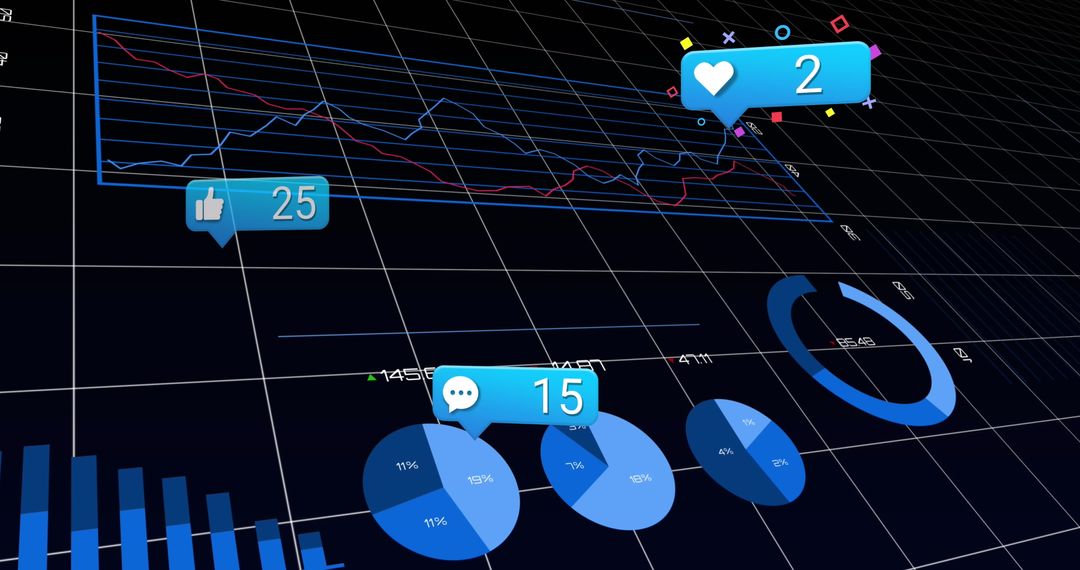
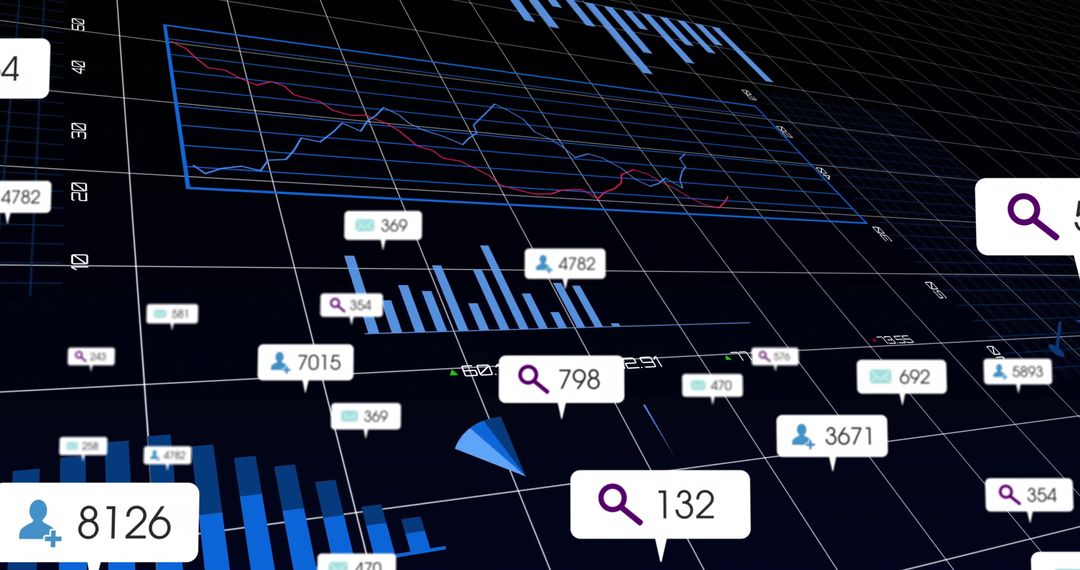
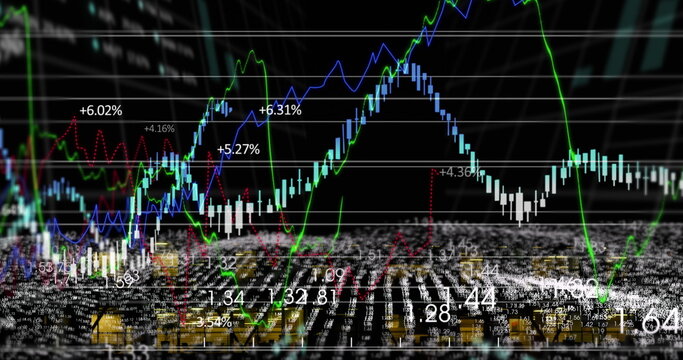
- 3D Red Bar Graph and Line Diagram for Business Analytics
3D Red Bar Graph and Line Diagram for Business Analytics Image

Dynamic representation of data with 3D red bars and a fluctuating red line highlights business intelligence. Labels and grid overlay emphasize analytics simplicity. Useful for presentations, digital dashboards, data analytics websites, or modern finance contexts.
Powered by 


0
downloads
downloads
Tags:
More
Credit Photo
If you would like to credit the Photo, here are some ways you can do so
Text Link
photo Link
<span class="text-link">
<span>
<a target="_blank" href=https://pikwizard.com/photo/3d-red-bar-graph-and-line-diagram-for-business-analytics/7b59f6d2ec821b7e8ac110cec02b54f8/>PikWizard</a>
</span>
</span>
<span class="image-link">
<span
style="margin: 0 0 20px 0; display: inline-block; vertical-align: middle; width: 100%;"
>
<a
target="_blank"
href="https://pikwizard.com/photo/3d-red-bar-graph-and-line-diagram-for-business-analytics/7b59f6d2ec821b7e8ac110cec02b54f8/"
style="text-decoration: none; font-size: 10px; margin: 0;"
>
<img src="https://pikwizard.com/pw/medium/7b59f6d2ec821b7e8ac110cec02b54f8.jpg" style="margin: 0; width: 100%;" alt="" />
<p style="font-size: 12px; margin: 0;">PikWizard</p>
</a>
</span>
</span>
Free (free of charge)
Free for personal and commercial use.
Author: Awesome Content
Similar Free Stock Images

Premium


Premium


Premium


Premium


Premium


Premium


Premium


Premium


Premium


Premium


Premium


Premium


Premium


Premium


Premium


Premium


Premium


Premium