- Home >
- Stock Photos >
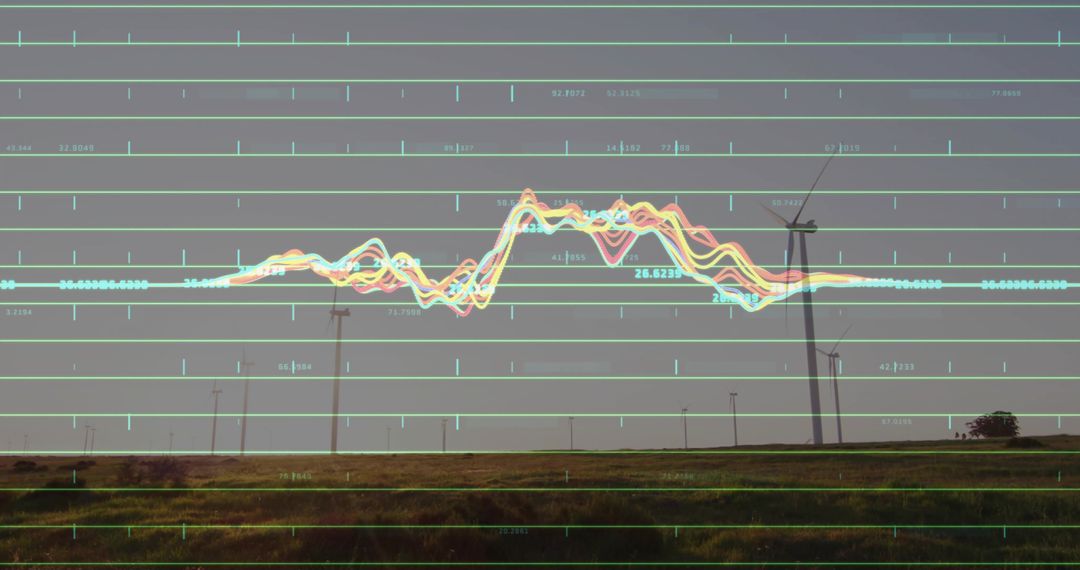
- Abstract Data Visualization with Colorful Arrows and Circles
Abstract Data Visualization with Colorful Arrows and Circles Image

Abstract visualization over colorful shapes highlights data processing and analysis. Ideal for illustrating digital interfaces, business reports, and technological themes in articles or presentations. Enhances design concepts related to data science and global information technology.
Powered by 


2
downloads
downloads
Tags:
More
Credit Photo
If you would like to credit the Photo, here are some ways you can do so
Text Link
photo Link
<span class="text-link">
<span>
<a target="_blank" href=https://pikwizard.com/photo/abstract-data-visualization-with-colorful-arrows-and-circles/d774bfc177c22cdce3163c95704a8301/>PikWizard</a>
</span>
</span>
<span class="image-link">
<span
style="margin: 0 0 20px 0; display: inline-block; vertical-align: middle; width: 100%;"
>
<a
target="_blank"
href="https://pikwizard.com/photo/abstract-data-visualization-with-colorful-arrows-and-circles/d774bfc177c22cdce3163c95704a8301/"
style="text-decoration: none; font-size: 10px; margin: 0;"
>
<img src="https://pikwizard.com/pw/medium/d774bfc177c22cdce3163c95704a8301.jpg" style="margin: 0; width: 100%;" alt="" />
<p style="font-size: 12px; margin: 0;">PikWizard</p>
</a>
</span>
</span>
Free (free of charge)
Free for personal and commercial use.
Author: Authentic Images
Similar Free Stock Images

Premium


Premium


Premium


Premium


Premium


Premium


Premium


Premium


Premium


Premium


Premium


Premium


Premium


Premium


Premium


Premium


Premium


Premium


Premium


Premium


Premium


Premium


Premium


Premium