
- Home >
- Stock Photos >
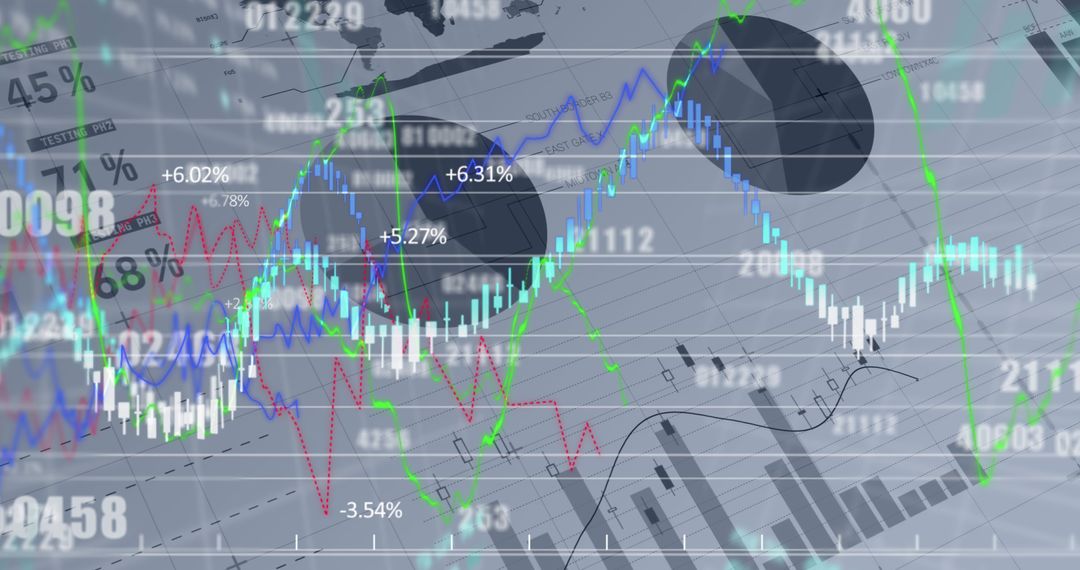
- Abstract Digital Data Charts Illustrating Market Trends
Abstract Digital Data Charts Illustrating Market Trends Image

Abstract illustration depicting stock market charts and numerical data. Striking digital visual of market trends showcasing a series of fluctuating graph lines and numbers against a dark grid background. Perfect for use in financial services branding, economic presentations, or technology blogs focused on data analysis and stock trading.
Powered by  - Get 15% off with code: PIKWIZARD15


2
downloads
downloads
Tags:
More
Credit Photo
If you would like to credit the Photo, here are some ways you can do so
Text Link
photo Link
<span class="text-link">
<span>
<a target="_blank" href=https://pikwizard.com/photo/abstract-digital-data-charts-illustrating-market-trends/d41b6ae89d64f8aed7ad8a4c114b24ab/>PikWizard</a>
</span>
</span>
<span class="image-link">
<span
style="margin: 0 0 20px 0; display: inline-block; vertical-align: middle; width: 100%;"
>
<a
target="_blank"
href="https://pikwizard.com/photo/abstract-digital-data-charts-illustrating-market-trends/d41b6ae89d64f8aed7ad8a4c114b24ab/"
style="text-decoration: none; font-size: 10px; margin: 0;"
>
<img src="https://pikwizard.com/pw/medium/d41b6ae89d64f8aed7ad8a4c114b24ab.jpg" style="margin: 0; width: 100%;" alt="" />
<p style="font-size: 12px; margin: 0;">PikWizard</p>
</a>
</span>
</span>
Free (free of charge)
Free for personal and commercial use.
Author: People Creations
Similar Free Stock Images

Premium


Premium


Premium


Premium


Premium


Premium


Premium


Premium


Premium


Premium


Premium


Premium


Premium


Premium


Premium


Premium


Premium


Premium


Premium


Premium


Premium


Premium


Premium


Premium

