1. Home > 
  2. Stock Photos > 
  3. Abstract Digital Dataset Overlays with Holographic Charts

Abstract Digital Dataset Overlays with Holographic Charts Image

Abstract Digital Dataset Overlays with Holographic Charts

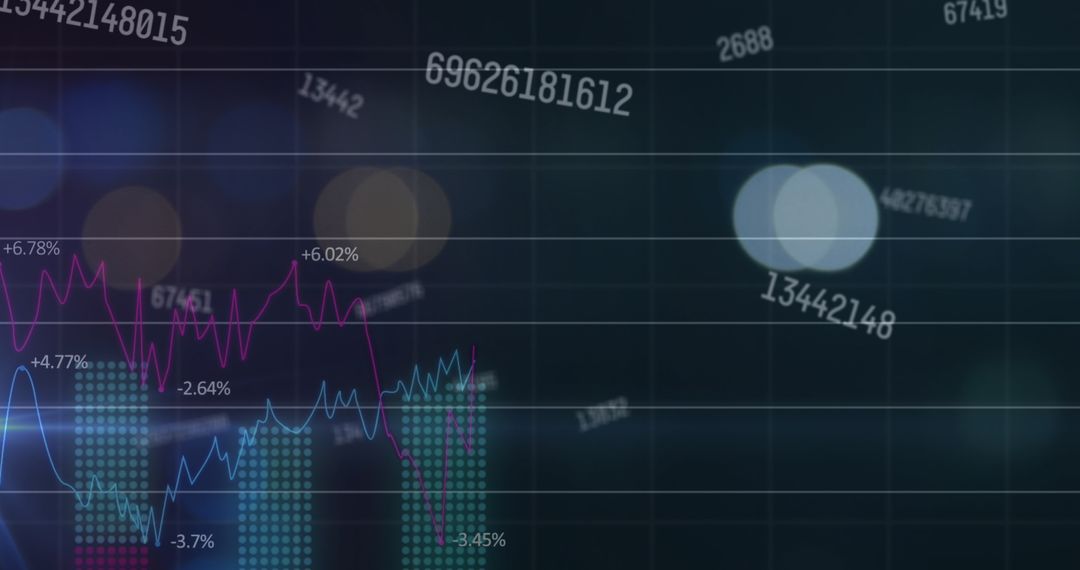
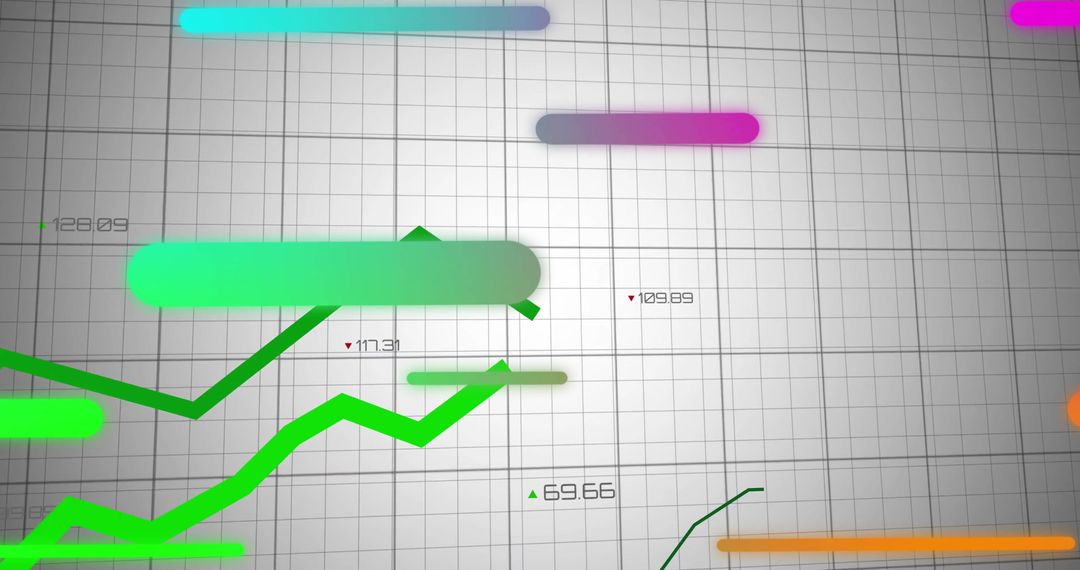
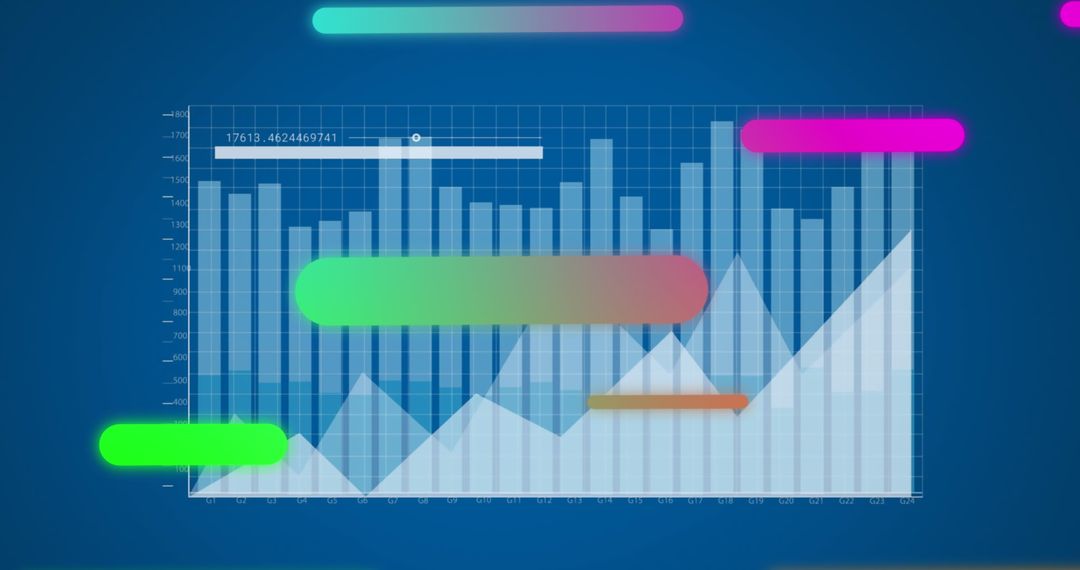
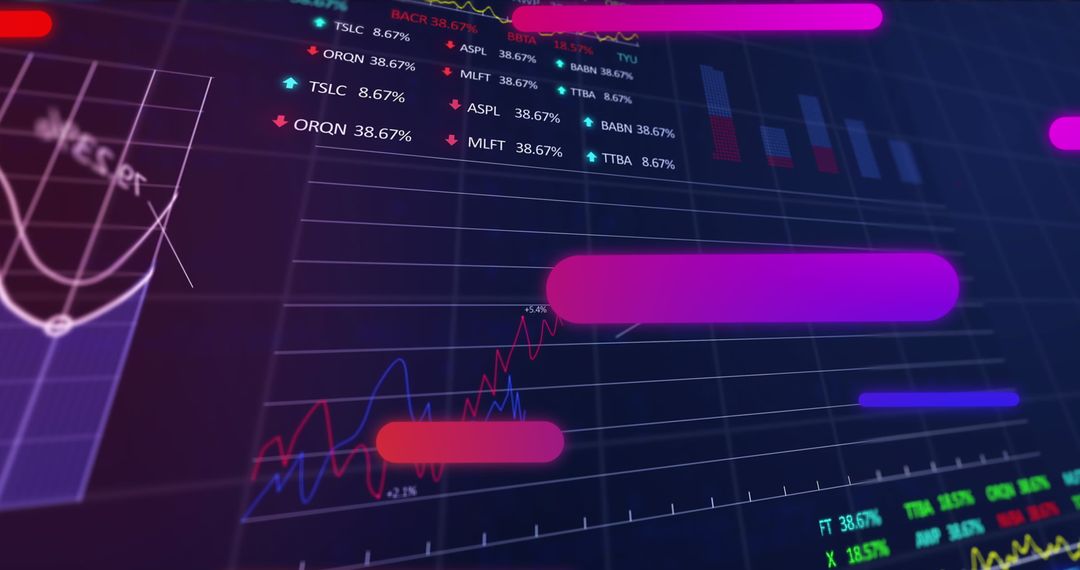
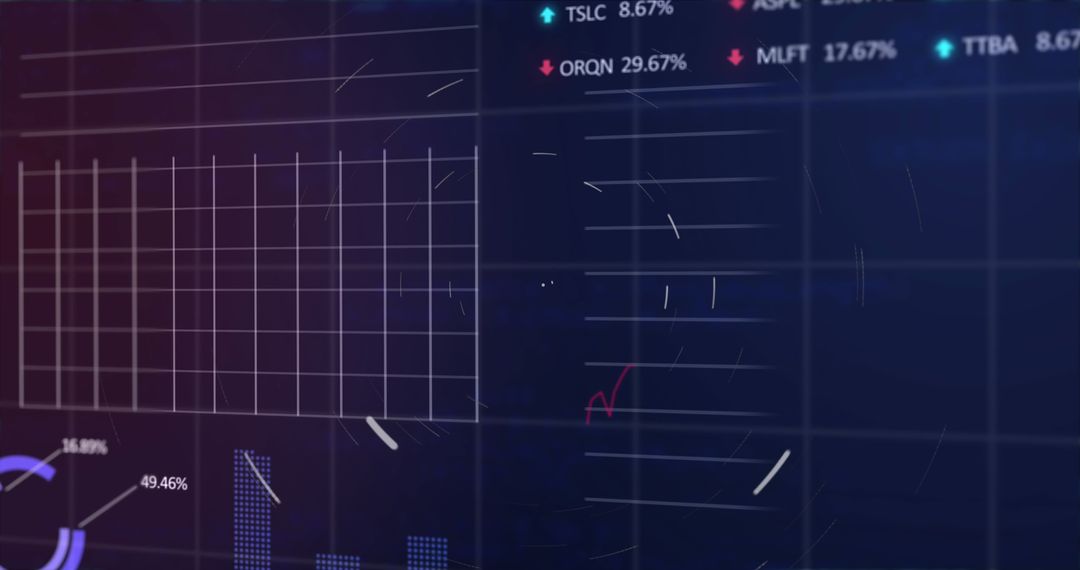
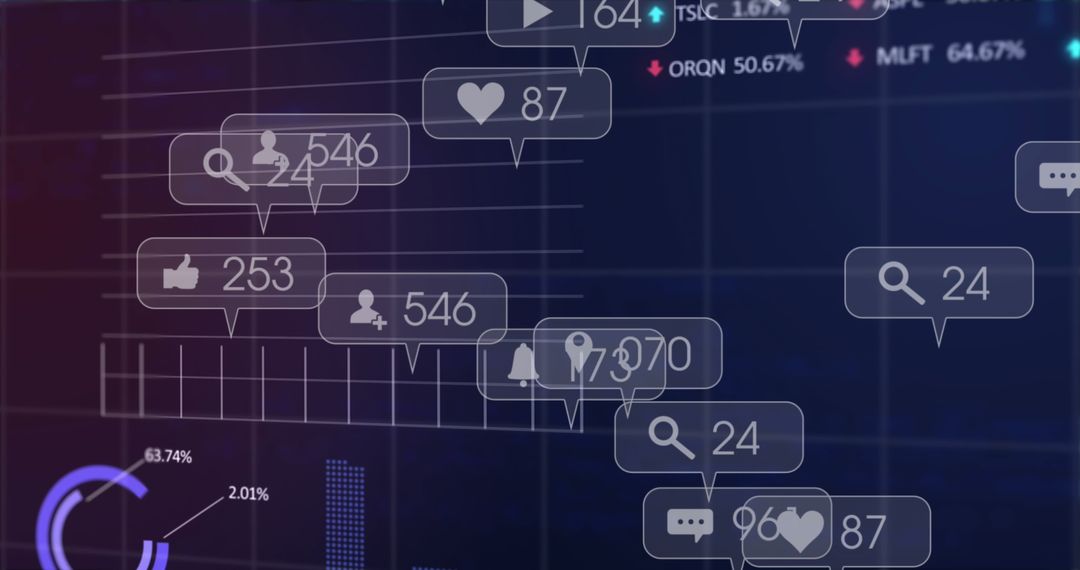
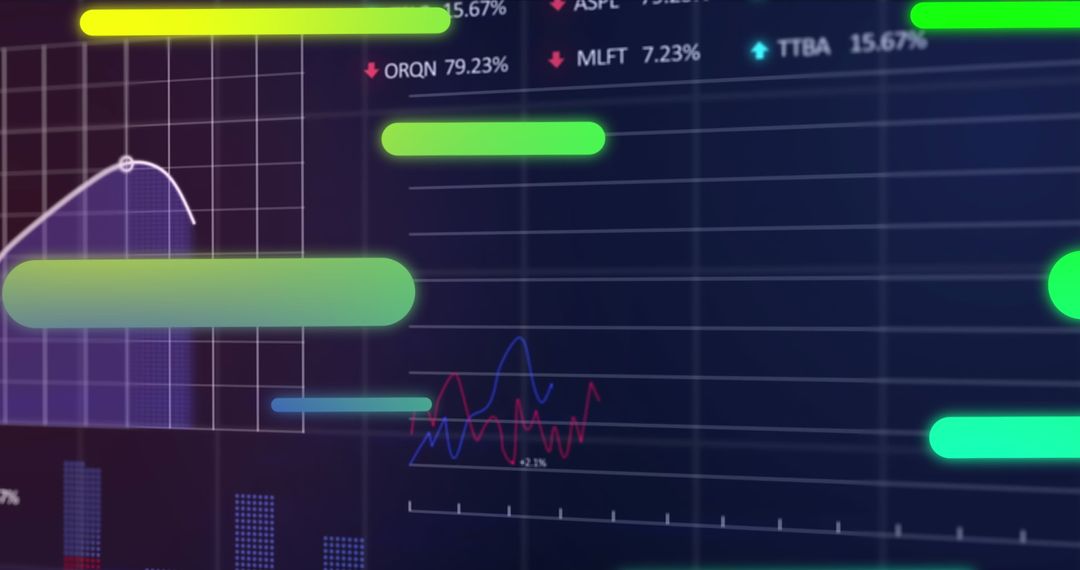
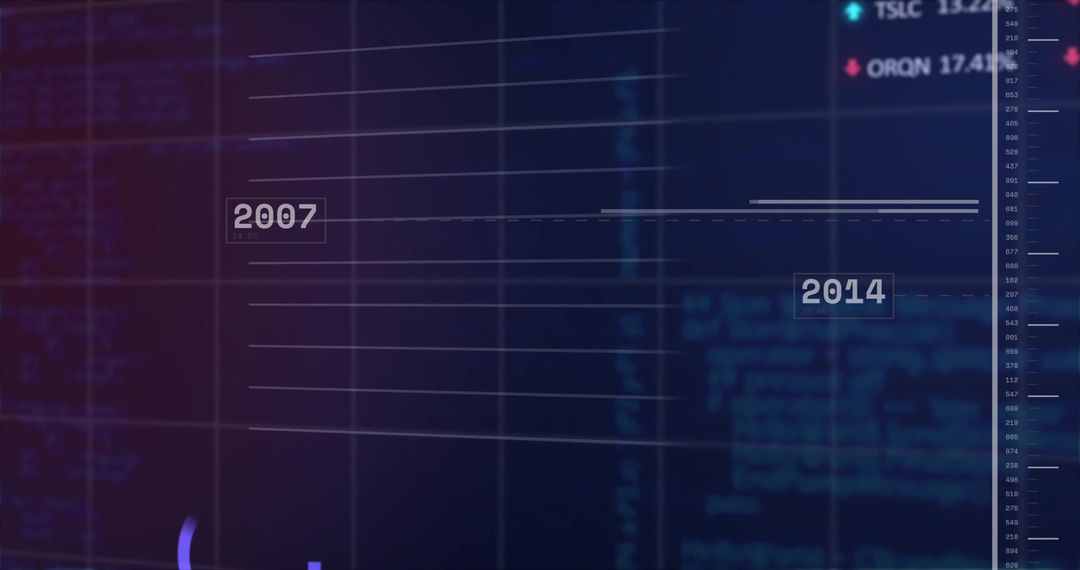
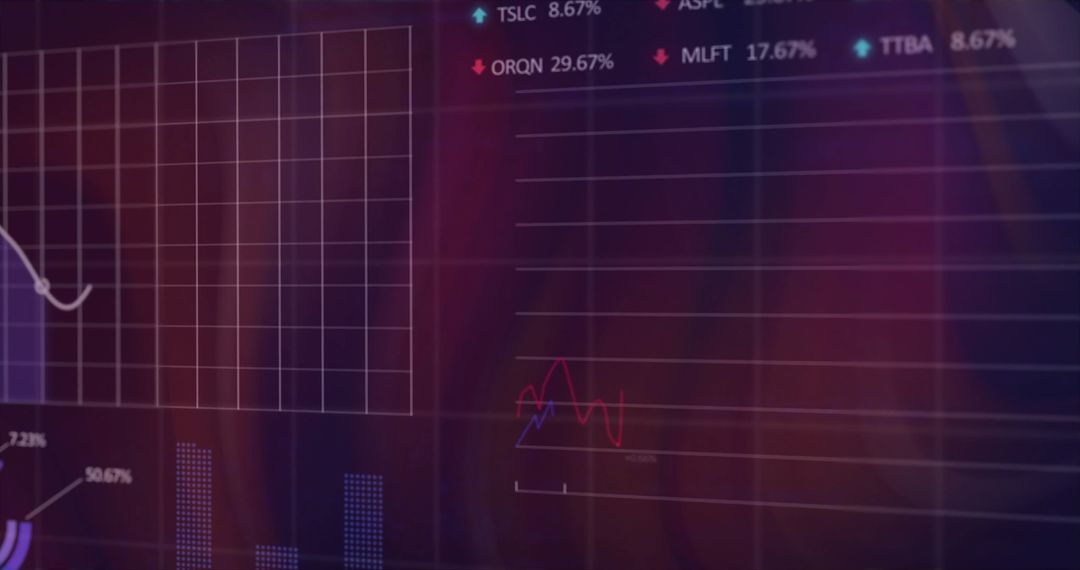
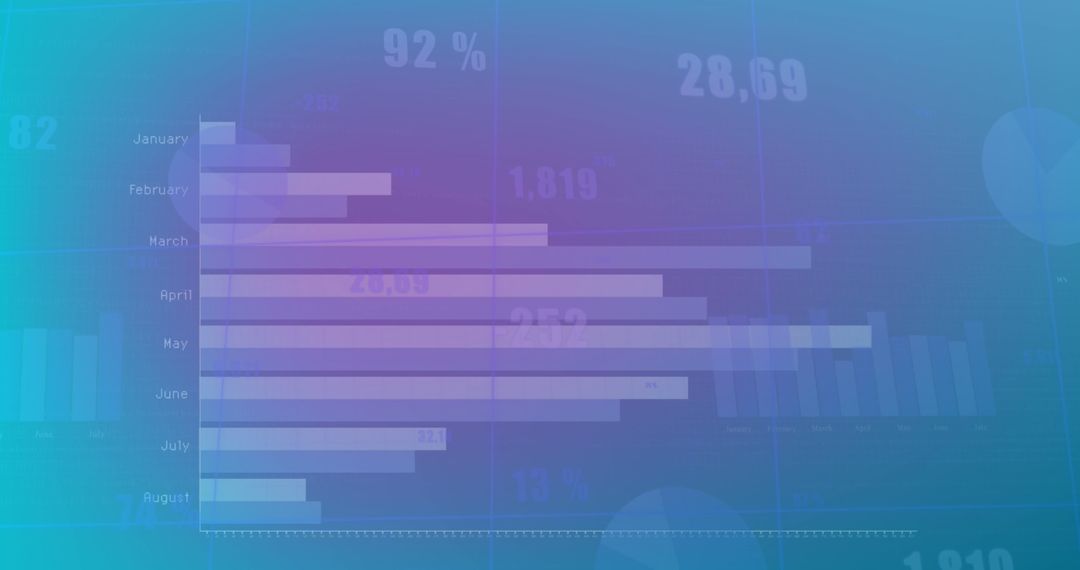
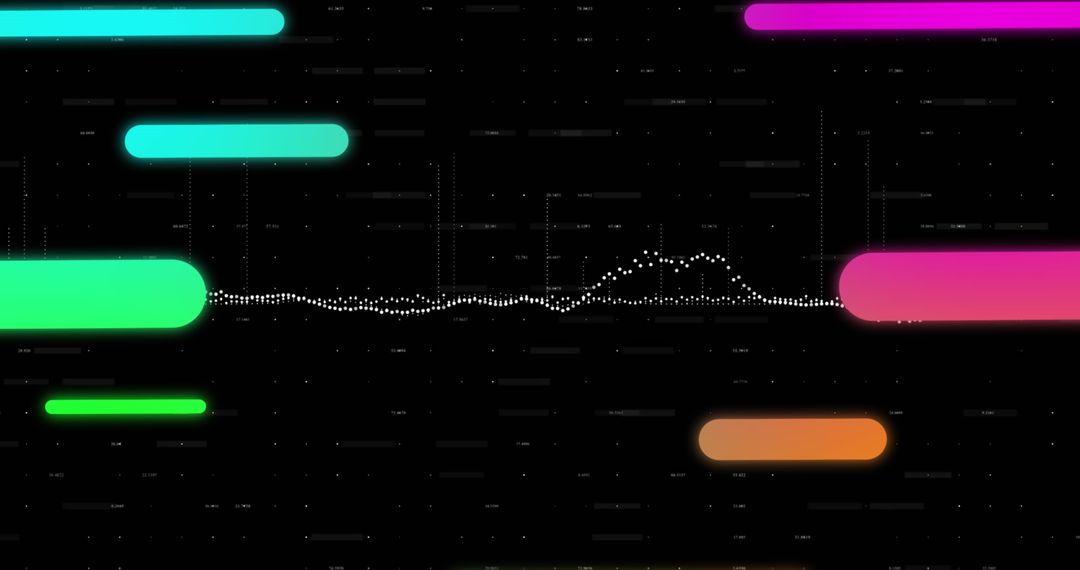
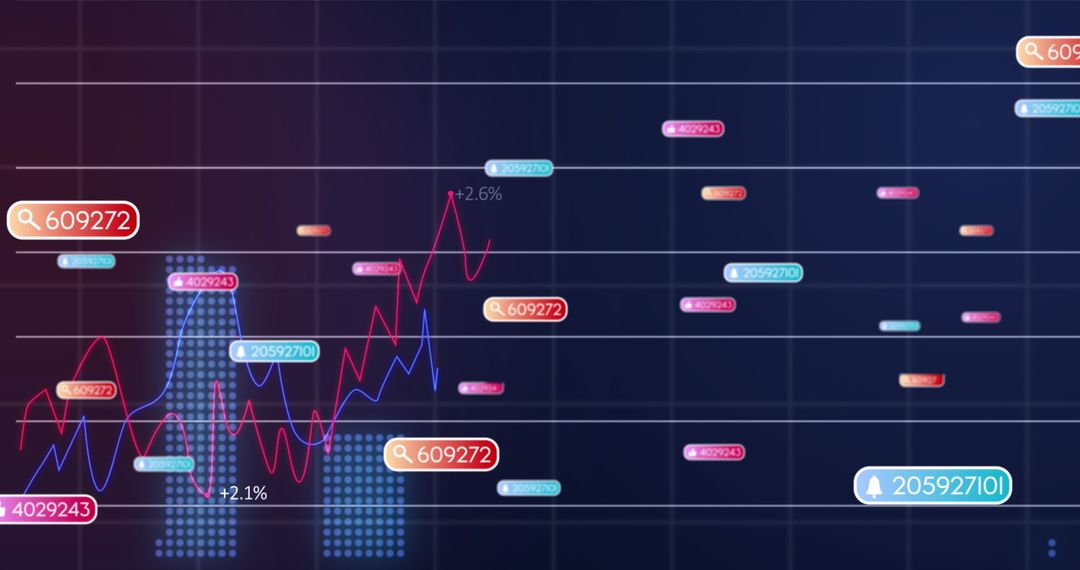
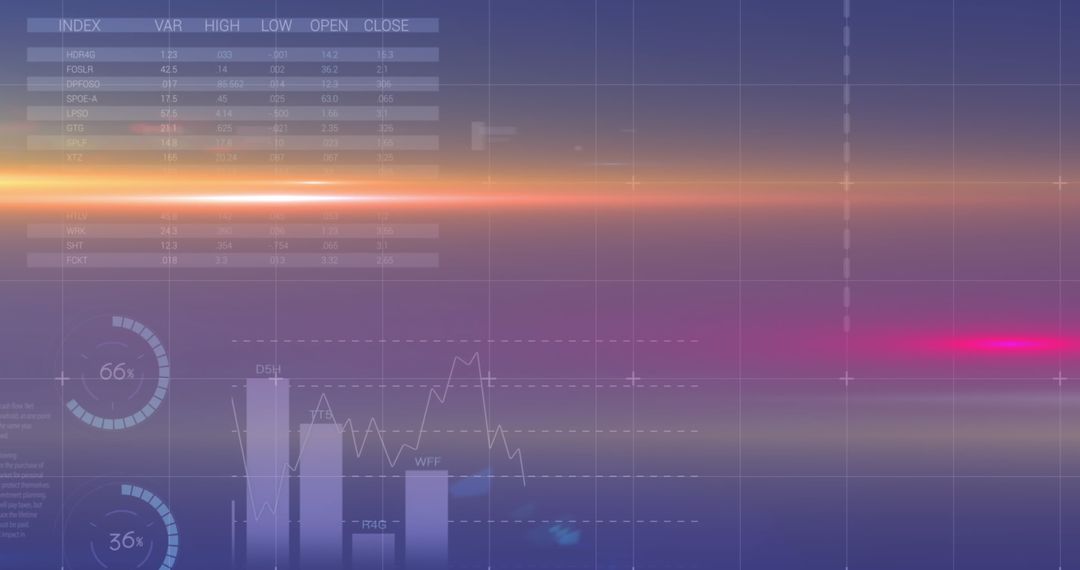
Abstract digital patterns superimpose on graphs and trading boards, set against a blue background, creating a fusion of technology and finance. Perfect for use in presentations related to data analysis, stock market projections, machine learning advancements, and financial technology reports. This visual serves as an intriguing backdrop for articles aiming to explore the interplay between coding technologies and financial markets.

Powered by Shutterstock logo - Get 15% off with code: PIKWIZARD15
Business Analytics Finance Neural Network AI Big Data Technology Data scientists query, analyze, and visualize complex datasets on a virtual screen. information flow concept processing of bigdata - Powered by Shutterstock - Get 15% off with code: PIKWIZARD15Business Analytics Finance Neural Network AI Big Data Technology Data scientists query, analyze, and visualize complex datasets on a virtual screen. information flow concept processing of bigdata - Powered by Shutterstock - Get 15% off with code: PIKWIZARD15Close-up of a young taro plant in a natural garden area with clearly visible leaf details. Photographed for a machine learning dataset. - Powered by Shutterstock - Get 15% off with code: PIKWIZARD15smart medical concept, artificial intelligence use for detect cancer or injury in brain it use deep learning brought what is known as Neural Networks as a way to analyze large and complex datasets.  - Powered by Shutterstock - Get 15% off with code: PIKWIZARD15Programming code and abstract technology Background - Powered by Shutterstock - Get 15% off with code: PIKWIZARD15

Credit Photo

If you would like to credit the Photo, here are some ways you can do so

Free (free of charge)

Free for personal and commercial use.

Author: Creative Art

Similar Free Stock Images

Colorful Light Trails on Blue Gradient Background
Premium
Data Science: Businessman control and monitoring data science technology system on digital screen. analytics, machine learning, data visualization, predictive modeling, big data, automation.
Dynamic Financial Data Elements on Abstarct Grid
Abstract Math Formulas and Graphs Pink Background Piece
Multicolored Abstract Spherocylinder Illustration with Gradient Background
Digital Data Processing Graph Interface with Progress Bar
Premium
Displaying Union Jack flag in dashboard, streaming numeric data, line graphs, bar charts. Patriotism, technology, innovation, data analytics, modern, financial, digital
Data Loading Bar with Digital Interface Elements
Abstract Chart with Multicolor Accents Representing Business Analytics
Abstract Digital Chart with Cyber Grid Background
Financial Data Analysis with Dynamic Digital Interface
Premium
Business Analytics Finance Neural Network AI Big Data Technology Data scientists query, analyze, and visualize complex datasets on a virtual screen. information flow concept processing of bigdata
Digital Financial Data Visualization with Bar Graphs and Line Charts
Digital Visualization Financial Data Growth Progressive Graph
Digital Financial Graph Illustrating Stock Market Trends
Gradient Shapes Against Abstract Patterns on Black Canvas
Premium
Floppy disk drive and diskette on white background
Digital Interface with Financial Data and Graphs on Black Background
Abstract Digital Stock Market Interface with Graphs and Data
Digital Financial Data Analysis with Vibrant Graphs
Digital Financial Data Analysis and Stock Market Charting
Futuristic DNA Windows Background with Gradient and Abstract Signal Waves
Digital Data Analytics Growth Trend with Graphs
Colorful Stock Market Candlestick Chart on Digital Grid
Data Visualization with Diagrams on Green Gradient
Animated Financial Graph with Candlestick Chart
Digital Interface with Data Graphs and Media Icons
Financial Data Charts with Viewing Grid in Dark Perspective
Digital Financial Data Analysis with Chart and Markers
Digital Financial Data Stream with Numeric Overlay
Premium
Stylized head hovering in virtual data interface, with dot matrix overlay and colored line graphs. Futuristic, technology, analytics, digital, interface, high-tech, data visualization
Ukrainian Flag with Financial Graphs Depicting Economic Crisis
Bright Multicolored Capsule Shapes on Abstract Blue Background
Financial Data Processing with Digital Interface
Financial Data Display in Digital Grid Design
Premium
Dataset writting on laptop keyboard background.
Digital Interface with Data Graphs and Charts on Blue Background
Financial Analysis with VR Technology in Modern Office
Data Analytics and Stock Market Graphs
Dynamic Notification Interface with Stocks and Social Media Alerts
Premium
Raw files, photos on the computer white display. Ready to edit. Photoshop logo. 7. 31. 2024 Shtip Macedonia
Abstract Financial Charts with Colorful Holographic Effects
Digital Analytics and Cybersecurity on Blue Tech Background
Digital Interface with Data Analytics and Processing Visuals
Futuristic Social Media and Stock Market Interface Design
Abstract Financial Data Visualization and Stock Market Analysis
Digital Finance: Holographic Trading and Tech Visualization
Innovative Digital Monthly Growth Chart Background for Data Analysis
Colorful Financial Data Analytics and Digital Graph
Abstract Financial Data Visualization with Graphs and Grid Background
Financial Data Processing in Digital Environment
Financial Data Analytics Over Digital Grid Screen
Dynamic Financial Data Chart on Green Gradient Background
Data Analytics Interface with Digital Technology Timeline
Futuristic Digital Interface with Charts and Data Visualization
Abstract Digital Financial Data Graph Chart
Digital Graphs Displaying Financial Data Analysis in Blue
Abstract Financial Data and Numbers in Virtual Environment
Abstract Data Graph Infographic on Purple Gradient Background
Premium
Abstract picture of a hand grip made of metal shot in high detail with a macro lens for datasets and learning collections.
Vibrant Multicolor Glowing Capsules on Abstract Background
Vibrant 25% Off Sale Display with Neon Shapes on Blue
Abstract Data Visualization on Blue Background
Digital Financial Chart and Chemical Structurals Illustration
Premium
Business Analytics Finance Neural Network AI Big Data Technology Data scientists query, analyze, and visualize complex datasets on a virtual screen. information flow concept processing of bigdata
Digital Abstract Graph Showing Financial Growth and Currency Analysis
Financial Data Processing Over Digital Grid with Code Elements
Abstract Digital Purple Geometric Pattern with Grid Overlay
Dynamic Lines Show Rising Financial Statistics Over Time
Premium
Close-up of binary code and fiber optic cables with dynamic light effects, concept of big data and technology
Digital Stock Market Data with Graphs and Numbers in Hologram Style
Data Analytics with Dynamic Global Market Trends on Screen
Futuristic Digital Waves and Lines Depicting Stock Market Fluctuations
Digital Grid Overlaying Cityscape with Abstract Lines
Abstract Financial Data Analysis and Stock Market Trends
Secure Data Analytics with Financial Graphs and Padlock Over Ukraine Flag
Social Media Integration with Statistical Data Analysis
Colorful Bar Graph with Digital Financial Data Analysis Display
Digital Display of Financial Data with Graph and Figures
Financial Stock Market Trends Over Digital Grid Background
Financial Data Processing with Molecular Overlay in a Digital Interface
Abstract Digital Interface with Data Bars on Gradient Background
Dynamic Financial Graph Displaying Market Trends
Dynamic Financial Graph with Data Analysis Conceptual Background
Dynamic Stock Market Indicators and Graphs on Blue Background
Digital Financial Data and Dynamic Stock Market Graphs
Chalkboard Mathematics Concepts on Gradient Background
Ukraine Crisis Financial Graphs Overlay
Premium
Displaying white infographic showing numeric values on screen with red and blue charts, grid lines. Data visualization, analytics, futuristic, digital interface, dashboard, data trends, technology
Advanced Financial Data and Chemical Structures Processing
Abstract Financial Network and Global Data Analysis Visualization
Financial Data Analysis Graph with Growing Trends
Abstract Financial Data Visualization with Holographic Elements
Premium
Businessman working with laptop and abstract infographic data
Colorful Financial Data Visualization on Digital Grid
Statistical Data and Trends Over Digital Grid Overlay
Digital Screen Displaying Stock Market Index Data Trends
Colorful Data Analytics Bar Graphs on Digital Screen
Premium
Program code with stacks of coins and abstract technology background
Complex Financial Data Visualization with Graphs
Digital Data Visualization with Glowing Graphs and Code Overlay
Abstract Graphic Business Data Visualization
Dynamic Financial Data Chart on Blue Background
Dynamic Financial Graphs with Holographic Elements on Orange Background
Stock Market Graph with Social Media Notifications Overlay
Dynamic Display of Financial Graphs and Stock Market Data
Network of Connections and Financial Data on Graph
Digital Data Processing Chart and Interface on Pink Background
Finance Transforming with DNA and Digital Technology
Dynamic Financial Data Growth Chart Display
Financial Data Graphic with Rising Trends on Digital Grid
Dynamic Zigzag Line Chart Analytics Display with Gradient Bars