
- Home >
- Stock Photos >
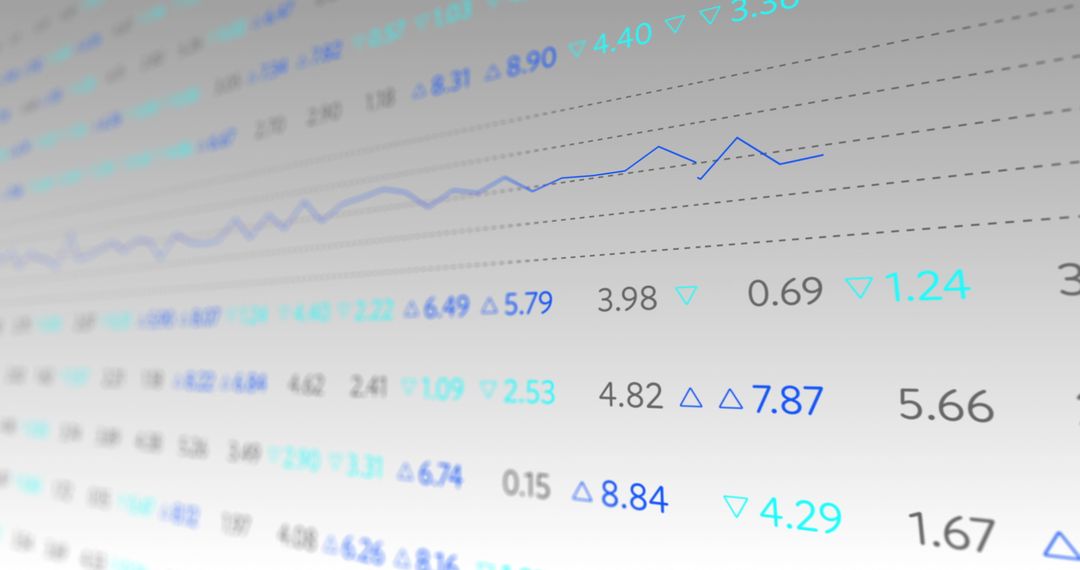
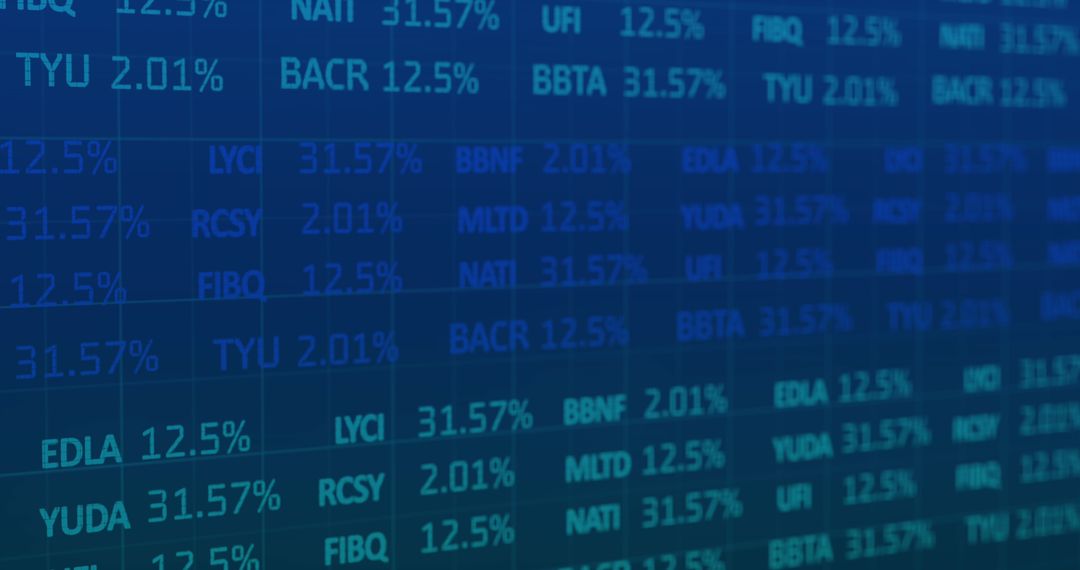
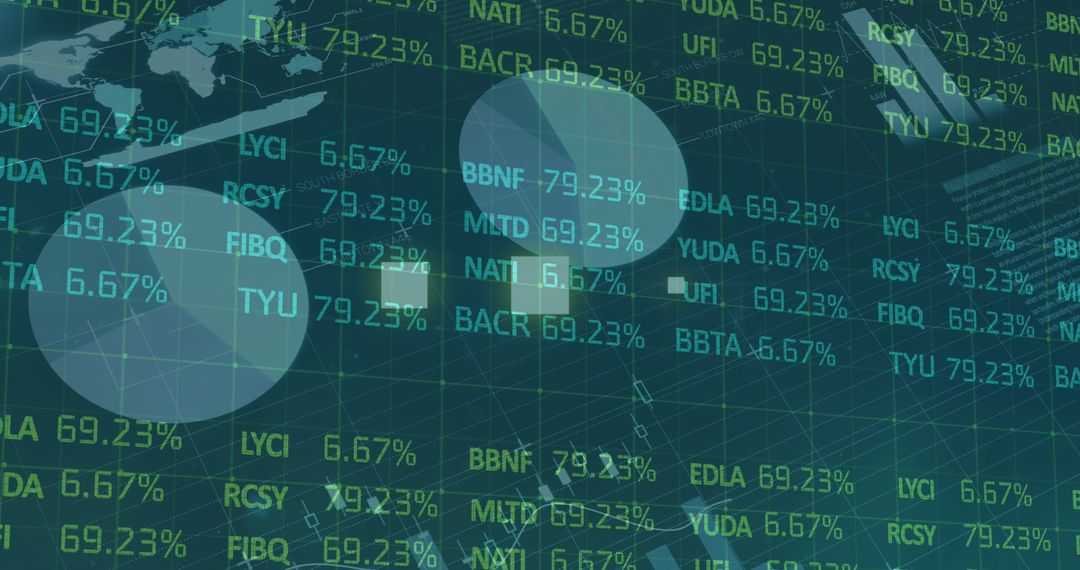
- Abstract Digital Display of Stock Market Trends and Data
Abstract Digital Display of Stock Market Trends and Data Image

This abstract image depicting digital stock market trends and financial data displays perceives numbers and graphs suggesting fluctuations. It can be useful for content related to finance, business analysis, investment opportunities, digital technology, and economic research. Ideal for websites, presentations, or any material focused on analyzing stock market behaviors.
Powered by 


2
downloads
downloads
Tags:
More
Credit Photo
If you would like to credit the Photo, here are some ways you can do so
Text Link
photo Link
<span class="text-link">
<span>
<a target="_blank" href=https://pikwizard.com/photo/abstract-digital-display-of-stock-market-trends-and-data/bd485b75f180aeef3d8035398d9e2d39/>PikWizard</a>
</span>
</span>
<span class="image-link">
<span
style="margin: 0 0 20px 0; display: inline-block; vertical-align: middle; width: 100%;"
>
<a
target="_blank"
href="https://pikwizard.com/photo/abstract-digital-display-of-stock-market-trends-and-data/bd485b75f180aeef3d8035398d9e2d39/"
style="text-decoration: none; font-size: 10px; margin: 0;"
>
<img src="https://pikwizard.com/pw/medium/bd485b75f180aeef3d8035398d9e2d39.jpg" style="margin: 0; width: 100%;" alt="" />
<p style="font-size: 12px; margin: 0;">PikWizard</p>
</a>
</span>
</span>
Free (free of charge)
Free for personal and commercial use.
Author: People Creations
Similar Free Stock Images
Premium


Premium


Premium


Premium


Premium


Premium


Premium


Premium


Premium


Premium


Premium


Premium


Premium


Premium


Premium


Premium


Premium


Premium


Premium


Premium


Premium


Premium


Premium


Premium

