- Home >
- Stock Photos >
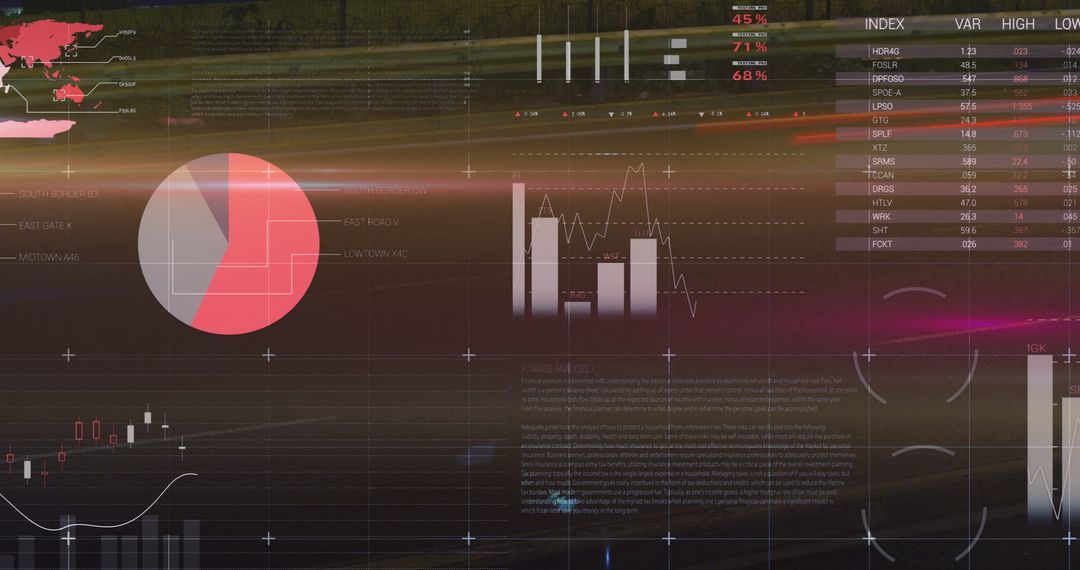
- Abstract Digital Interface with Charts and Graphs Overlay
Abstract Digital Interface with Charts and Graphs Overlay Image

Shows an abstract scene featuring digital charts and graphs overlaying a landscape. Represents modern digital technology and global connections. Useful for illustrating concepts related to data analytics, futuristic technology, or global networks. Ideal for business presentations, tech company websites, and educational materials focusing on digitalization.
Powered by  - Get 15% off with code: PIKWIZARD15


0
downloads
downloads
Tags:
More
Credit Photo
If you would like to credit the Photo, here are some ways you can do so
Text Link
photo Link
<span class="text-link">
<span>
<a target="_blank" href=https://pikwizard.com/photo/abstract-digital-interface-with-charts-and-graphs-overlay/e8389950c28d106829563c8c6f9ca71a/>PikWizard</a>
</span>
</span>
<span class="image-link">
<span
style="margin: 0 0 20px 0; display: inline-block; vertical-align: middle; width: 100%;"
>
<a
target="_blank"
href="https://pikwizard.com/photo/abstract-digital-interface-with-charts-and-graphs-overlay/e8389950c28d106829563c8c6f9ca71a/"
style="text-decoration: none; font-size: 10px; margin: 0;"
>
<img src="https://pikwizard.com/pw/medium/e8389950c28d106829563c8c6f9ca71a.jpg" style="margin: 0; width: 100%;" alt="" />
<p style="font-size: 12px; margin: 0;">PikWizard</p>
</a>
</span>
</span>
Free (free of charge)
Free for personal and commercial use.
Author: People Creations
Similar Free Stock Images

Premium


Premium


Premium


Premium


Premium


Premium


Premium


Premium


Premium


Premium


Premium


Premium


Premium


Premium


Premium


Premium


Premium


Premium


Premium


Premium


Premium


Premium


Premium


Premium