- Home >
- Stock Photos >
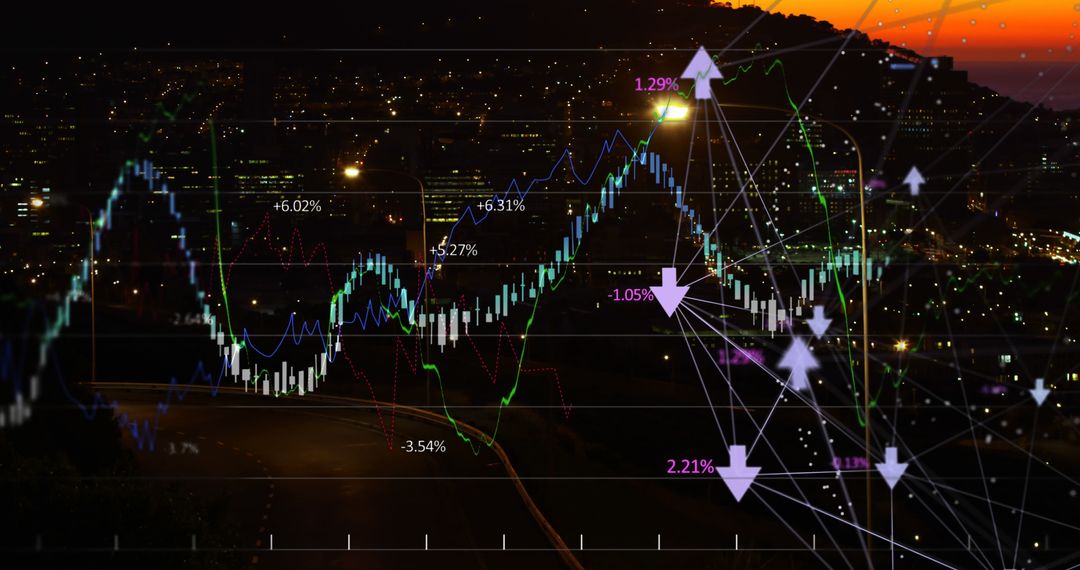
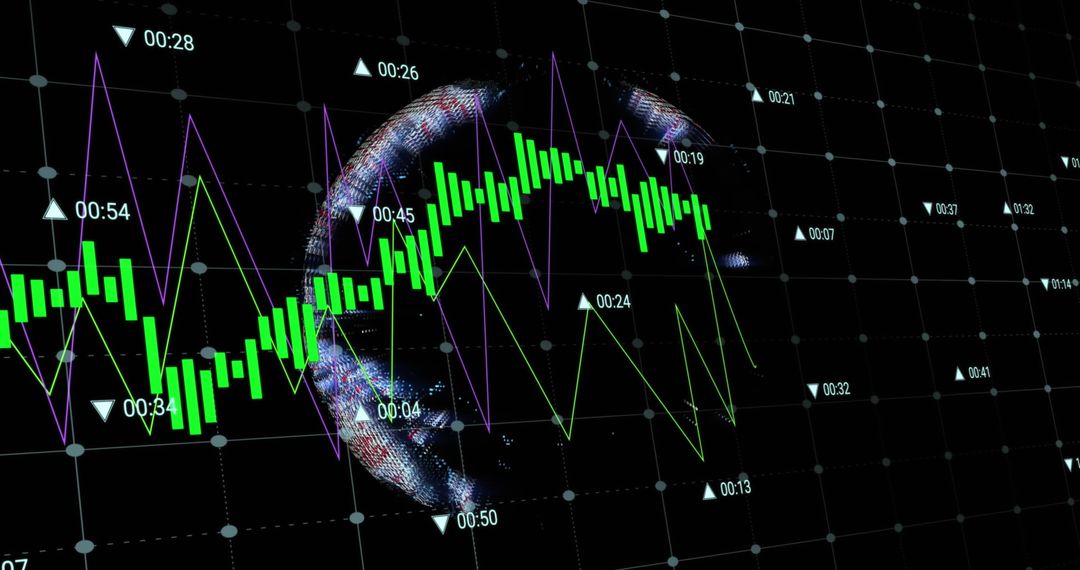
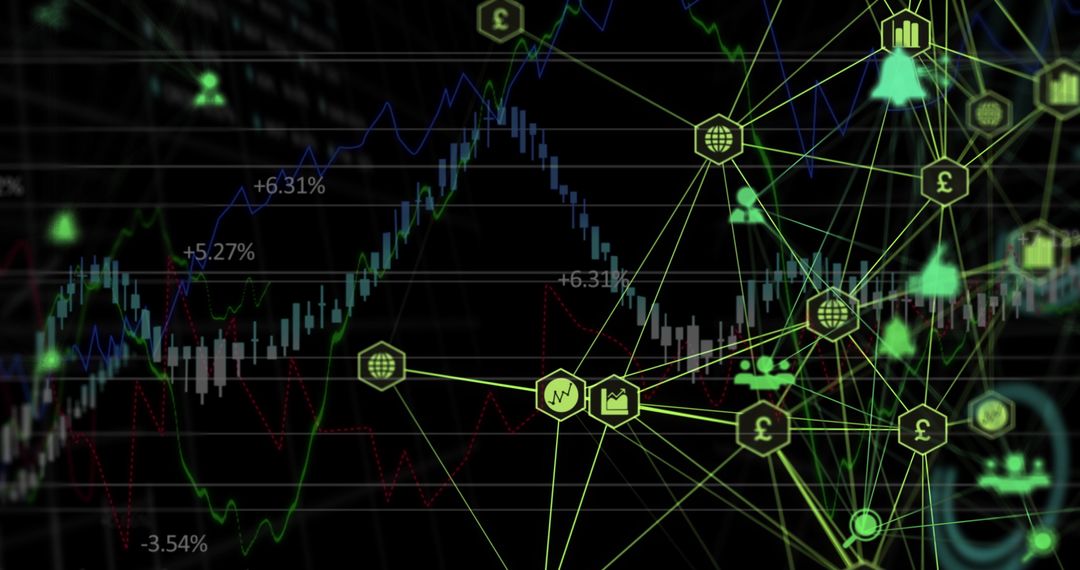
- Abstract Digital Stock Market Data Visualization
Abstract Digital Stock Market Data Visualization Image

This image depicts a digital interface displaying financial charts and data visualization with neon colors set against a dark background. The dynamic design underscores business and economic analysis, suitable for use in financial sector presentations, investment portfolios, fintech advertising, and educational materials on stock market trends.
Powered by 


2
downloads
downloads
Tags:
More
Credit Photo
If you would like to credit the Photo, here are some ways you can do so
Text Link
photo Link
<span class="text-link">
<span>
<a target="_blank" href=https://pikwizard.com/photo/abstract-digital-stock-market-data-visualization/708218392623d16206045b25bdc7645d/>PikWizard</a>
</span>
</span>
<span class="image-link">
<span
style="margin: 0 0 20px 0; display: inline-block; vertical-align: middle; width: 100%;"
>
<a
target="_blank"
href="https://pikwizard.com/photo/abstract-digital-stock-market-data-visualization/708218392623d16206045b25bdc7645d/"
style="text-decoration: none; font-size: 10px; margin: 0;"
>
<img src="https://pikwizard.com/pw/medium/708218392623d16206045b25bdc7645d.jpg" style="margin: 0; width: 100%;" alt="" />
<p style="font-size: 12px; margin: 0;">PikWizard</p>
</a>
</span>
</span>
Free (free of charge)
Free for personal and commercial use.
Author: Creative Art
Similar Free Stock Images

Premium


Premium


Premium


Premium


Premium


Premium


Premium


Premium


Premium


Premium


Premium


Premium


Premium


Premium


Premium


Premium


Premium


Premium


Premium


Premium


Premium


Premium


Premium


Premium