- Home >
- Stock Photos >
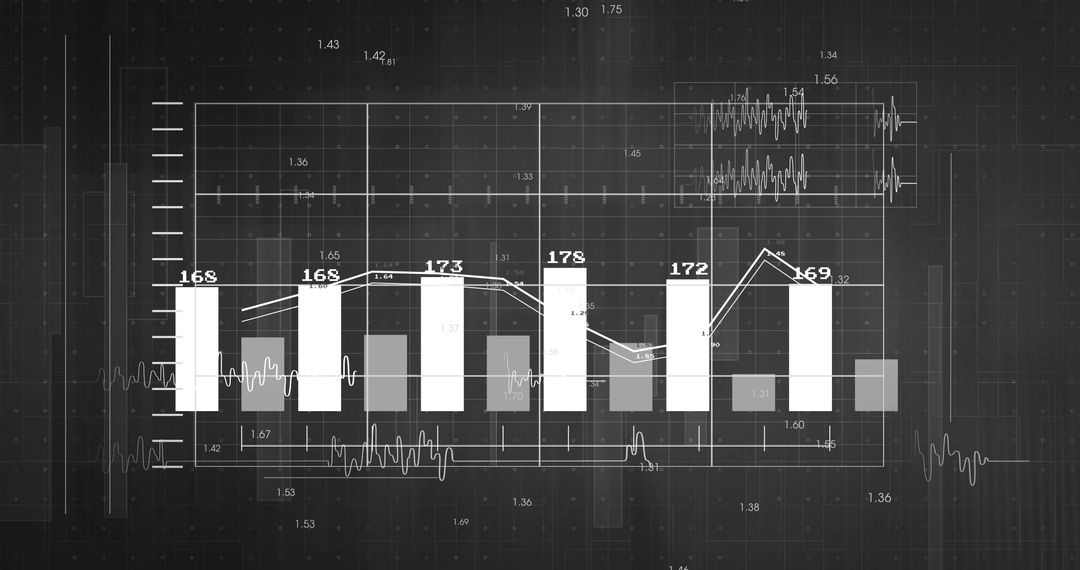
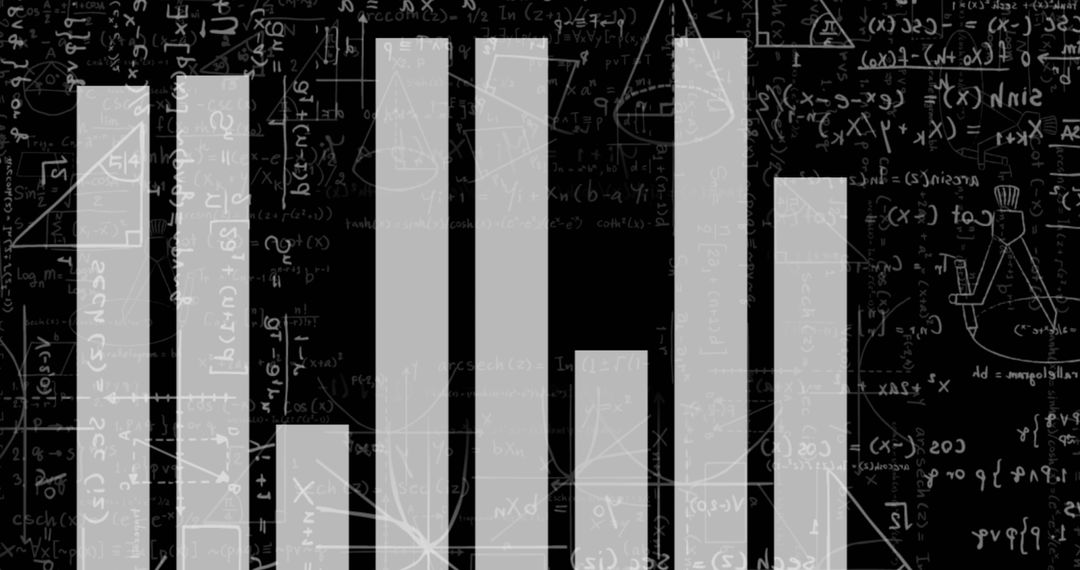
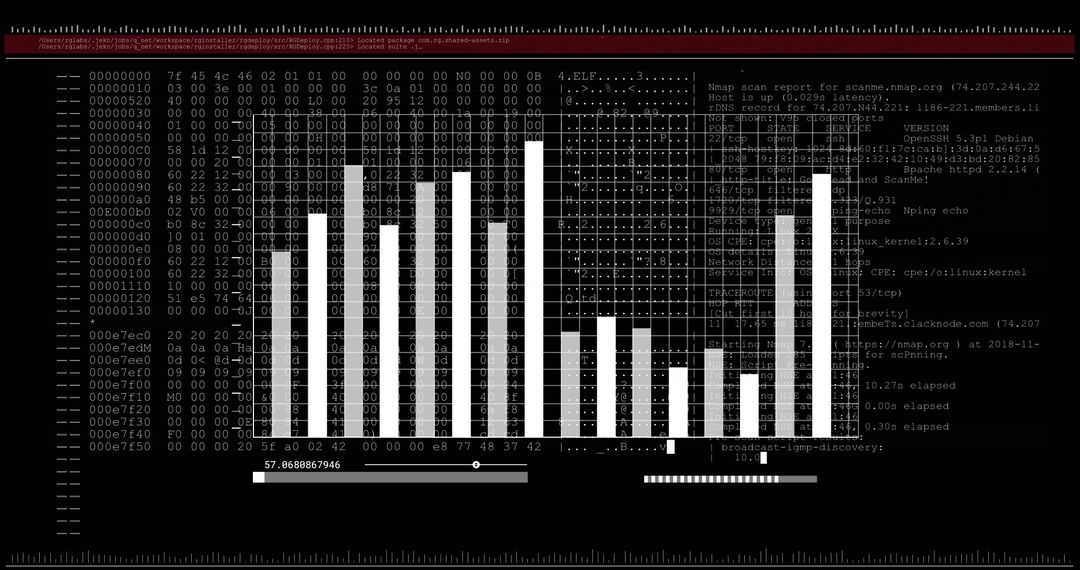
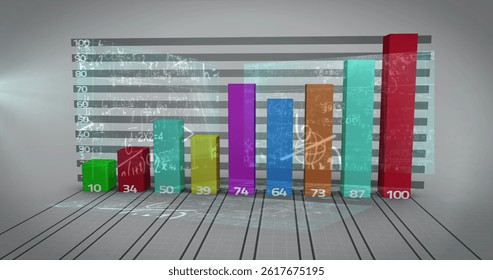
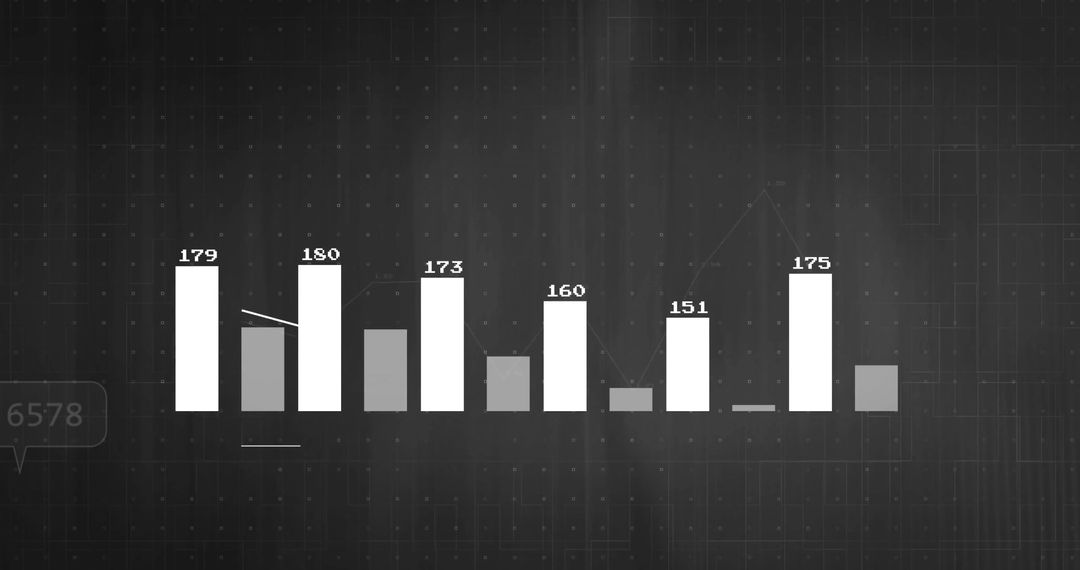
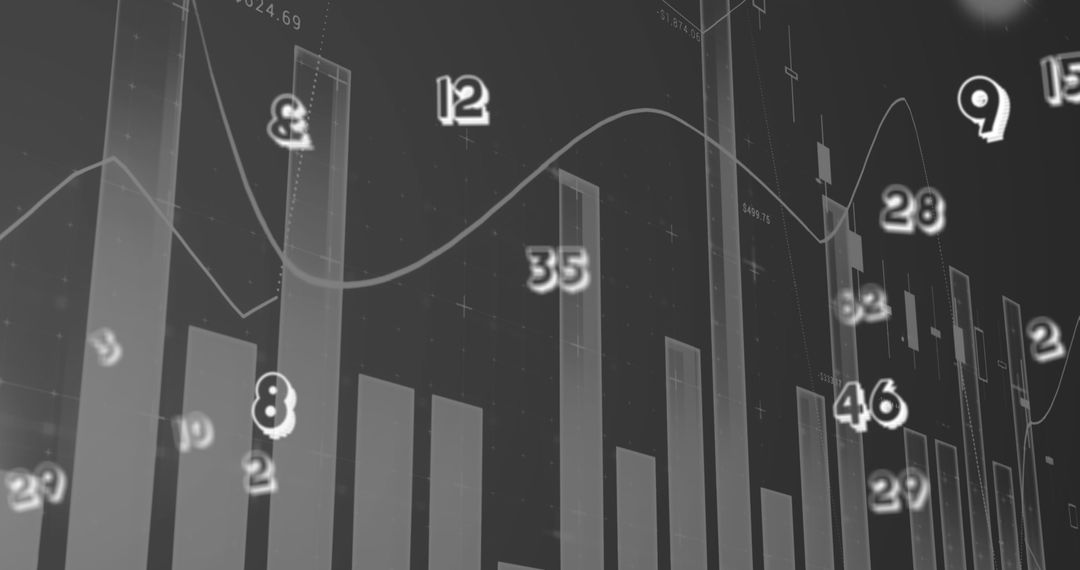
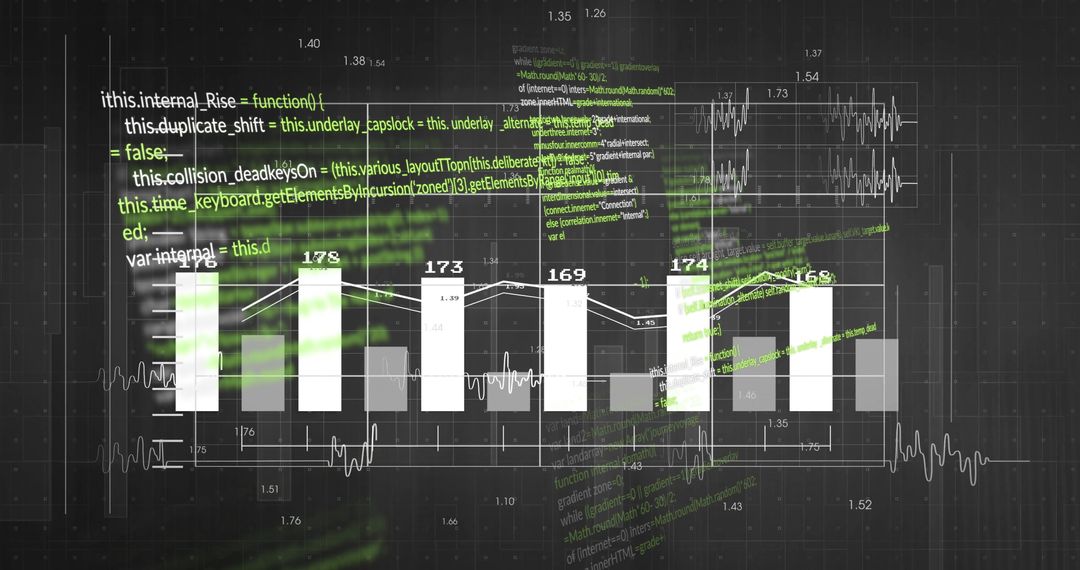
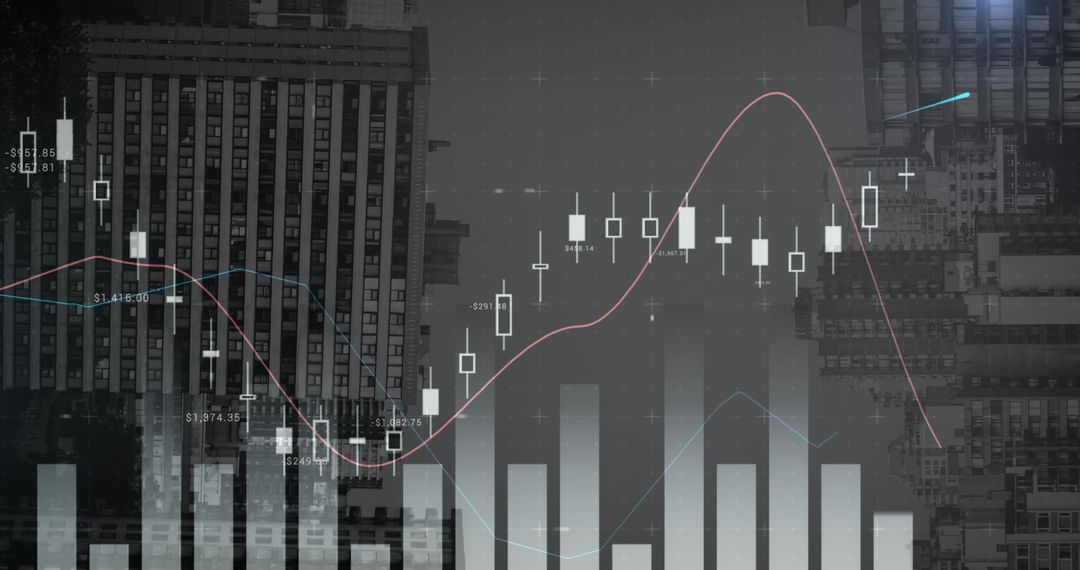
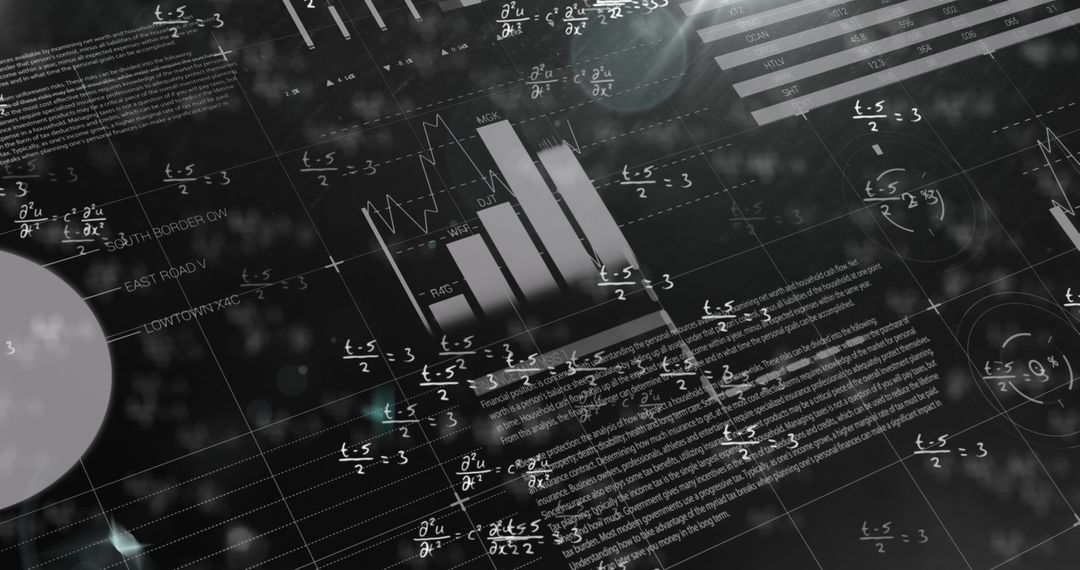
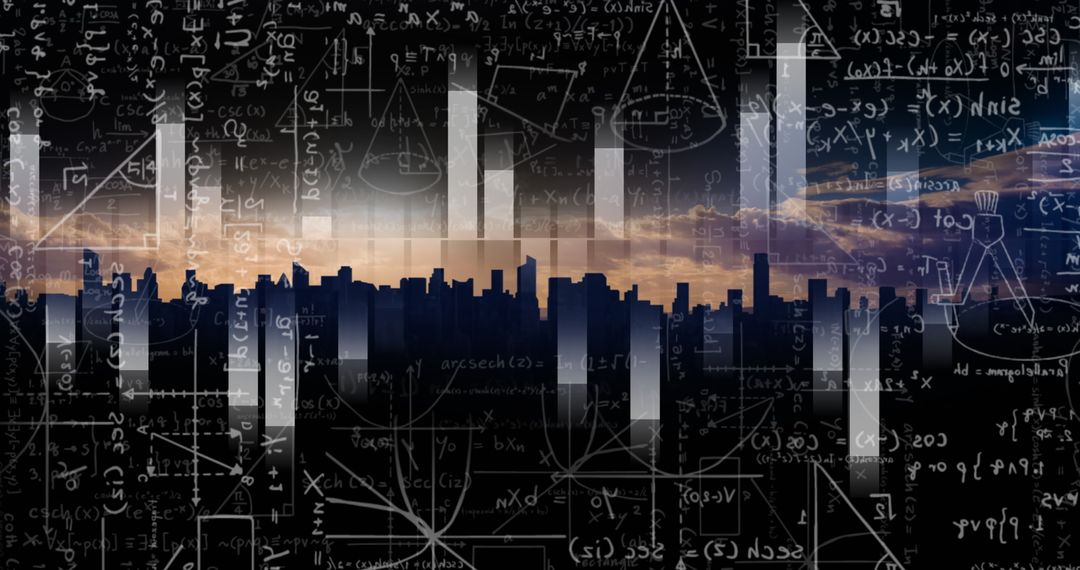
- Abstract Financial Analysis with Mathematical Equations Background
Abstract Financial Analysis with Mathematical Equations Background Image
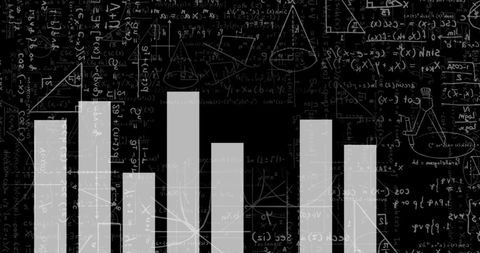
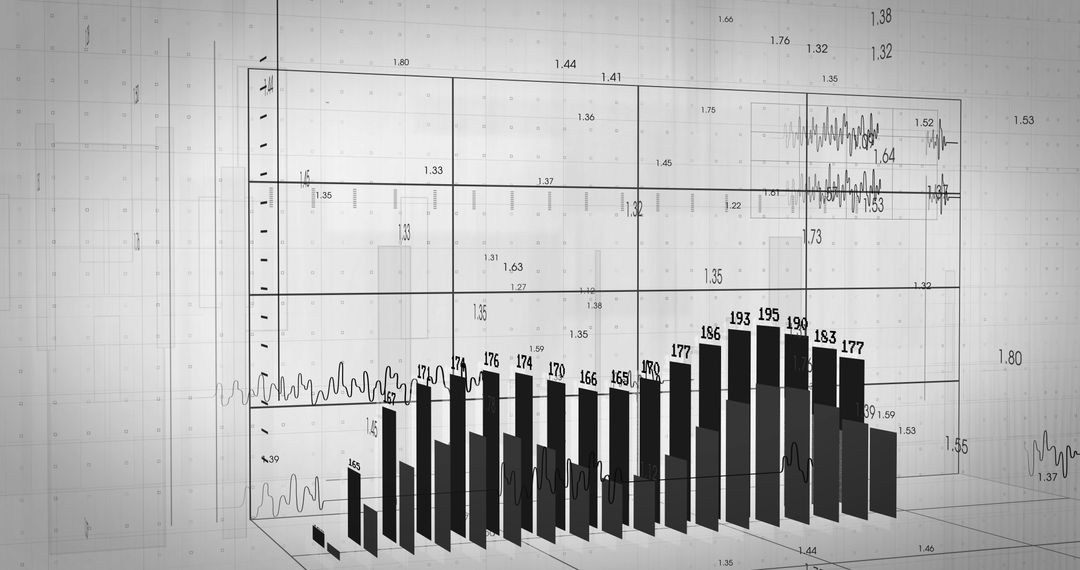
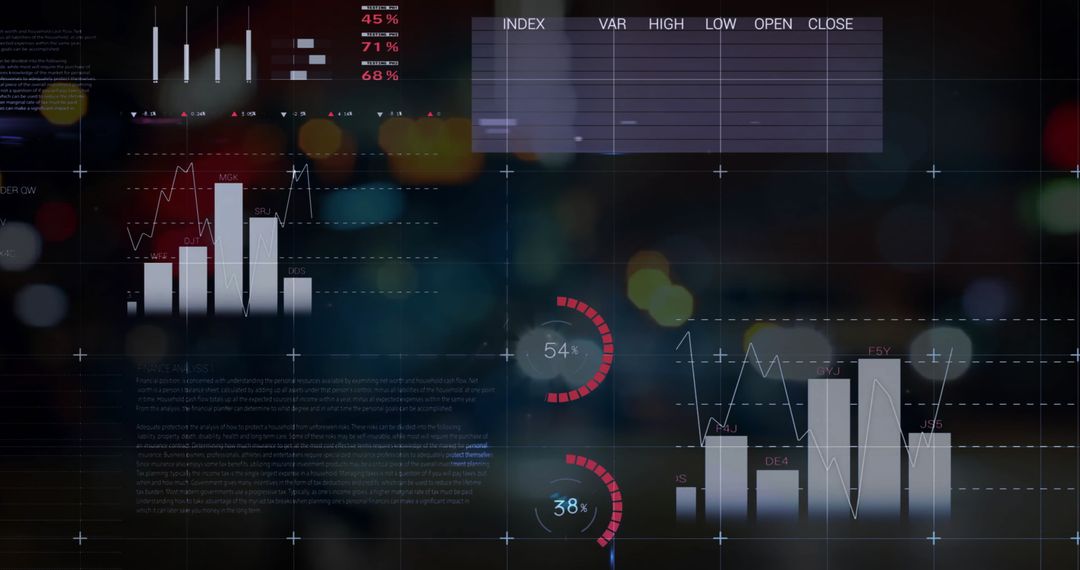
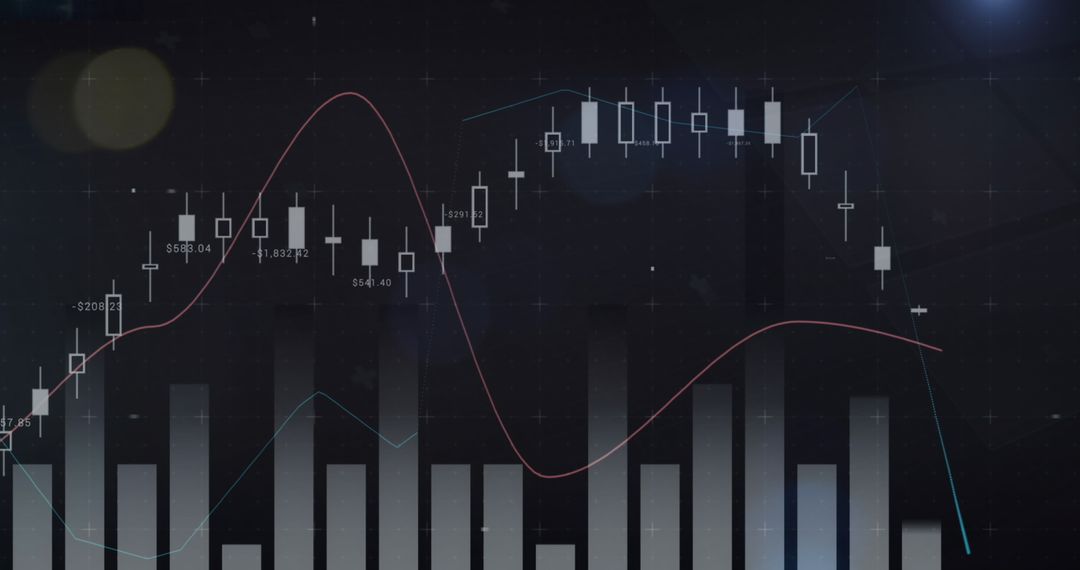
Visual representing financial data processing featuring bar graphs and a backdrop of complex mathematical equations. The scene signifies the intersection of global business, advanced finance, and digital connections. It is suitable for themes highlighting business finance, statistical analysis, technological innovation, or academic research.
Powered by  - Get 15% off with code: PIKWIZARD15


2
downloads
downloads
Tags:
More
Credit Photo
If you would like to credit the Photo, here are some ways you can do so
Text Link
photo Link
<span class="text-link">
<span>
<a target="_blank" href=https://pikwizard.com/photo/abstract-financial-analysis-with-mathematical-equations-background/d6a81aef129eb6acda6f86302619f5af/>PikWizard</a>
</span>
</span>
<span class="image-link">
<span
style="margin: 0 0 20px 0; display: inline-block; vertical-align: middle; width: 100%;"
>
<a
target="_blank"
href="https://pikwizard.com/photo/abstract-financial-analysis-with-mathematical-equations-background/d6a81aef129eb6acda6f86302619f5af/"
style="text-decoration: none; font-size: 10px; margin: 0;"
>
<img src="https://pikwizard.com/pw/medium/d6a81aef129eb6acda6f86302619f5af.jpg" style="margin: 0; width: 100%;" alt="" />
<p style="font-size: 12px; margin: 0;">PikWizard</p>
</a>
</span>
</span>
Free (free of charge)
Free for personal and commercial use.
Author: Awesome Content
Similar Free Stock Images
Premium

Premium


Premium


Premium


Premium


Premium


Premium


Premium


Premium


Premium


Premium


Premium


Premium


Premium


Premium


Premium


Premium


Premium


Premium


Premium


Premium


Premium


Premium


Premium