- Home >
- Stock Photos >
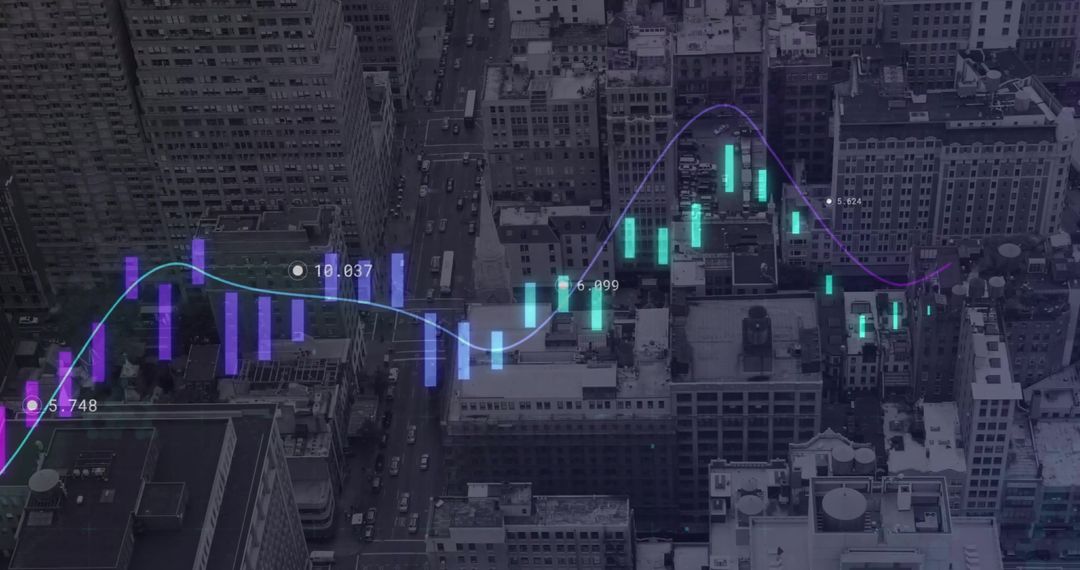
- Abstract Financial Chart Representing Market Data Trends
Abstract Financial Chart Representing Market Data Trends Image

Abstract depiction of a financial chart showcasing market data trends in a digital interface environment. Multicolored gradient with line graph elements illustrating technological concepts useful for presentations, articles related to economy, finance technology awareness, and digital data tools.
Powered by  - Get 15% off with code: PIKWIZARD15


2
downloads
downloads
Tags:
More
Credit Photo
If you would like to credit the Photo, here are some ways you can do so
Text Link
photo Link
<span class="text-link">
<span>
<a target="_blank" href=https://pikwizard.com/photo/abstract-financial-chart-representing-market-data-trends/599a05860fc620fd257a8b0735e2d789/>PikWizard</a>
</span>
</span>
<span class="image-link">
<span
style="margin: 0 0 20px 0; display: inline-block; vertical-align: middle; width: 100%;"
>
<a
target="_blank"
href="https://pikwizard.com/photo/abstract-financial-chart-representing-market-data-trends/599a05860fc620fd257a8b0735e2d789/"
style="text-decoration: none; font-size: 10px; margin: 0;"
>
<img src="https://pikwizard.com/pw/medium/599a05860fc620fd257a8b0735e2d789.jpg" style="margin: 0; width: 100%;" alt="" />
<p style="font-size: 12px; margin: 0;">PikWizard</p>
</a>
</span>
</span>
Free (free of charge)
Free for personal and commercial use.
Author: Authentic Images
Similar Free Stock Images

Premium


Premium


Premium


Premium


Premium


Premium


Premium


Premium


Premium


Premium


Premium


Premium


Premium


Premium


Premium


Premium


Premium


Premium


Premium


Premium


Premium


Premium


Premium


Premium