- Home >
- Stock Photos >
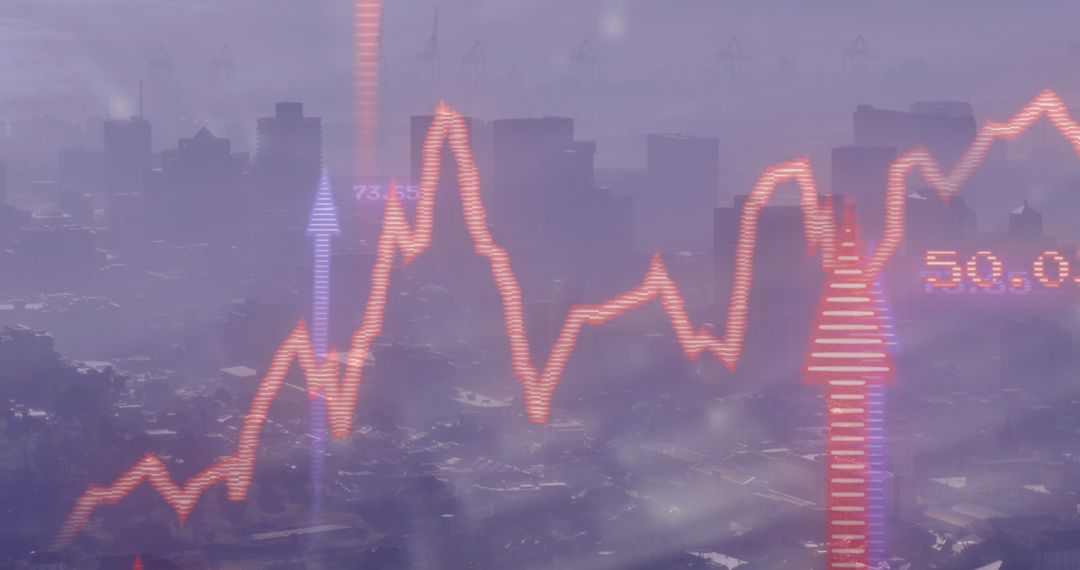
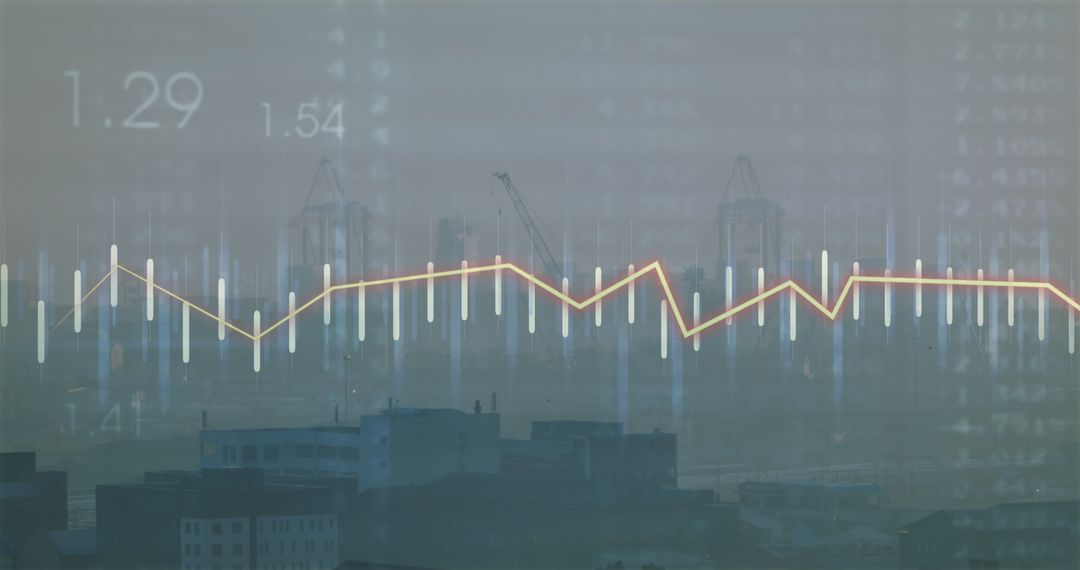
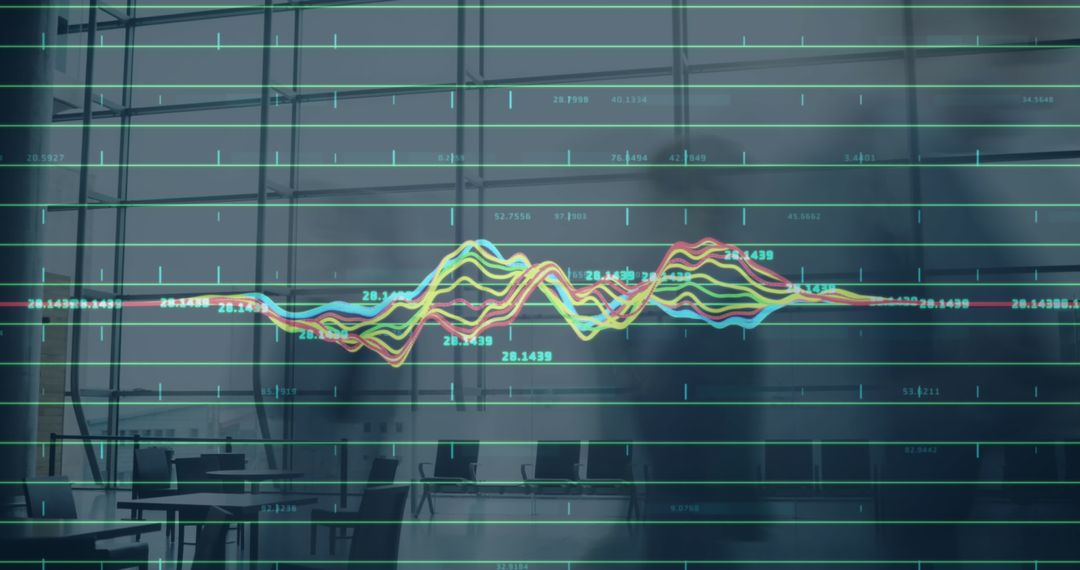
- Abstract Financial Chart with Red Line and Trend Arrows
Abstract Financial Chart with Red Line and Trend Arrows Image

Financial visualization showing intricate movement on graph overlaying digital symbols, likely indicating market trends. Suited for finance, economic reports, technology platforms, and investment analysis articles. Visual metaphor for economic change, volatility, and strategic growth.
Powered by  - Get 15% off with code: PIKWIZARD15


2
downloads
downloads
Tags:
More
Credit Photo
If you would like to credit the Photo, here are some ways you can do so
Text Link
photo Link
<span class="text-link">
<span>
<a target="_blank" href=https://pikwizard.com/photo/abstract-financial-chart-with-red-line-and-trend-arrows/e67762b9415f1d4750daccc5aab043a1/>PikWizard</a>
</span>
</span>
<span class="image-link">
<span
style="margin: 0 0 20px 0; display: inline-block; vertical-align: middle; width: 100%;"
>
<a
target="_blank"
href="https://pikwizard.com/photo/abstract-financial-chart-with-red-line-and-trend-arrows/e67762b9415f1d4750daccc5aab043a1/"
style="text-decoration: none; font-size: 10px; margin: 0;"
>
<img src="https://pikwizard.com/pw/medium/e67762b9415f1d4750daccc5aab043a1.jpg" style="margin: 0; width: 100%;" alt="" />
<p style="font-size: 12px; margin: 0;">PikWizard</p>
</a>
</span>
</span>
Free (free of charge)
Free for personal and commercial use.
Author: People Creations
Similar Free Stock Images

Premium


Premium


Premium


Premium


Premium


Premium


Premium


Premium


Premium


Premium


Premium


Premium


Premium


Premium


Premium


Premium


Premium


Premium


Premium


Premium


Premium


Premium


Premium


Premium