- Home >
- Stock Photos >
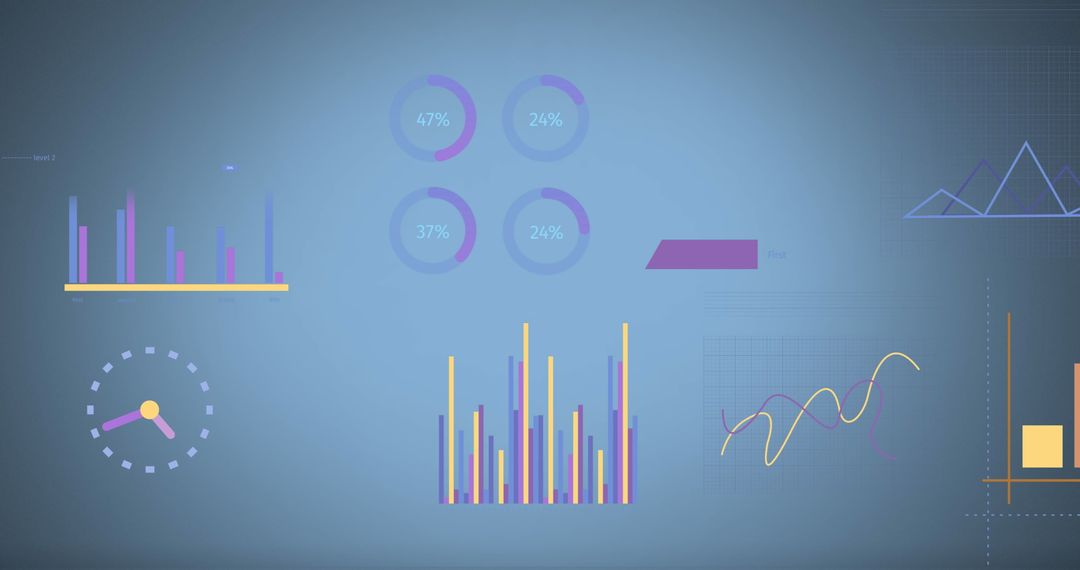
- Abstract Financial Charts and Data Visualizations
Abstract Financial Charts and Data Visualizations Image

Abstract representation of financial concepts with overlapping graphs and data visuals done in a classic holographic style. Ideal for illustrating modern business growth, stock market activities, and analysis in presentations, reports, and marketing materials related to the financial sector.
Powered by  - Get 15% off with code: PIKWIZARD15


2
downloads
downloads
Tags:
More
Credit Photo
If you would like to credit the Photo, here are some ways you can do so
Text Link
photo Link
<span class="text-link">
<span>
<a target="_blank" href=https://pikwizard.com/photo/abstract-financial-charts-and-data-visualizations/4bcdb773ba4788177c749f491e940098/>PikWizard</a>
</span>
</span>
<span class="image-link">
<span
style="margin: 0 0 20px 0; display: inline-block; vertical-align: middle; width: 100%;"
>
<a
target="_blank"
href="https://pikwizard.com/photo/abstract-financial-charts-and-data-visualizations/4bcdb773ba4788177c749f491e940098/"
style="text-decoration: none; font-size: 10px; margin: 0;"
>
<img src="https://pikwizard.com/pw/medium/4bcdb773ba4788177c749f491e940098.jpg" style="margin: 0; width: 100%;" alt="" />
<p style="font-size: 12px; margin: 0;">PikWizard</p>
</a>
</span>
</span>
Free (free of charge)
Free for personal and commercial use.
Author: Authentic Images
Similar Free Stock Images
Premium


Premium


Premium


Premium


Premium


Premium


Premium


Premium


Premium


Premium


Premium


Premium


Premium


Premium


Premium


Premium


Premium


Premium


Premium


Premium


Premium


Premium


Premium


Premium