- Home >
- Stock Photos >
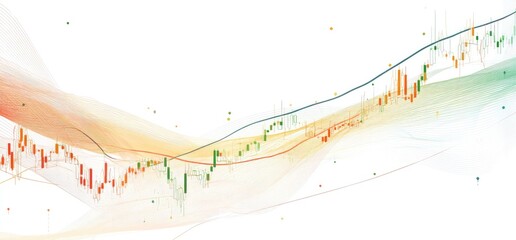
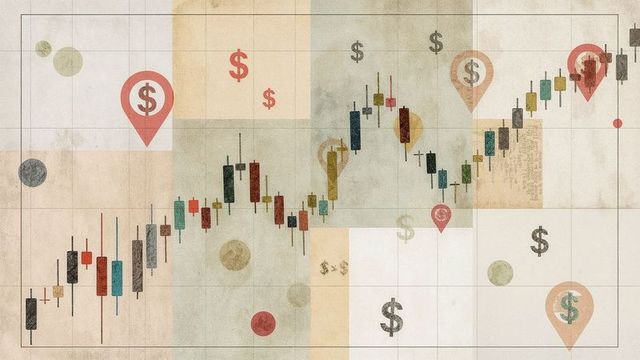
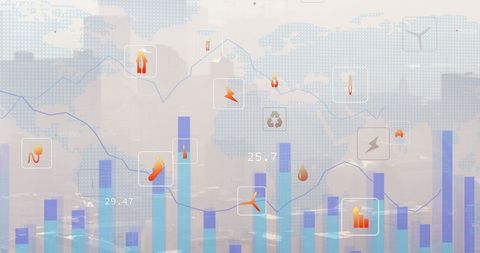
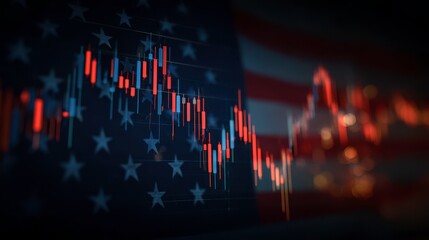
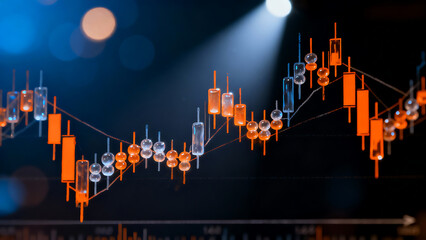
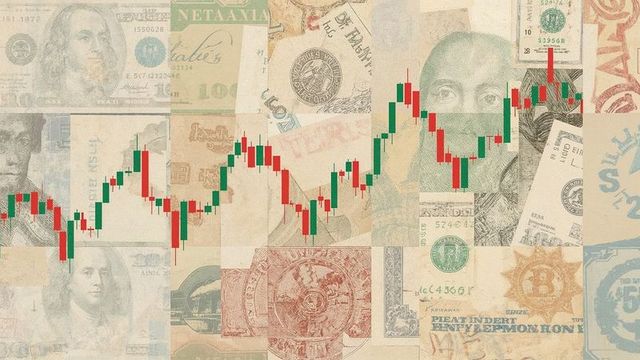
- Abstract Financial Collage Featuring Candlestick Chart and Currency Symbols
Abstract Financial Collage Featuring Candlestick Chart and Currency Symbols Image
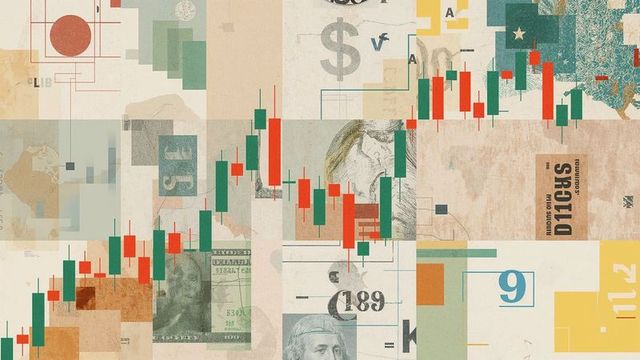
AI Generated Image. This artwork creatively combines elements of financial statistics and currency symbols in a visually captivating collage. It features candlestick chart patterns along with images of U.S. Dollar notes and various numbers and signs associated with the finance world. Ideal for use in financial websites, investment blogs, economic presentations, or digital newsletters to emphasize themes of trading, analytics, and market strategies.
Powered by 


0
downloads
downloads
Tags:
More
Credit Photo
If you would like to credit the Photo, here are some ways you can do so
Text Link
photo Link
<span class="text-link">
<span>
<a target="_blank" href=https://pikwizard.com/photo/abstract-financial-collage-featuring-candlestick-chart-and-currency-symbols/ac499cccfaf48423c1f5a0b99f9676e1/>PikWizard</a>
</span>
</span>
<span class="image-link">
<span
style="margin: 0 0 20px 0; display: inline-block; vertical-align: middle; width: 100%;"
>
<a
target="_blank"
href="https://pikwizard.com/photo/abstract-financial-collage-featuring-candlestick-chart-and-currency-symbols/ac499cccfaf48423c1f5a0b99f9676e1/"
style="text-decoration: none; font-size: 10px; margin: 0;"
>
<img src="https://pikwizard.com/pw/medium/ac499cccfaf48423c1f5a0b99f9676e1.jpg" style="margin: 0; width: 100%;" alt="" />
<p style="font-size: 12px; margin: 0;">PikWizard</p>
</a>
</span>
</span>
Free (free of charge)
Free for personal and commercial use.
Author: AI Creator
Similar Free Stock Images

Premium


Premium


Premium


Premium


Premium


Premium


Premium


Premium


Premium


Premium


Premium


Premium


Premium


Premium


Premium


Premium


Premium


Premium


Premium


Premium


Premium


Premium


Premium


Premium


Premium