- Home >
- Stock Photos >
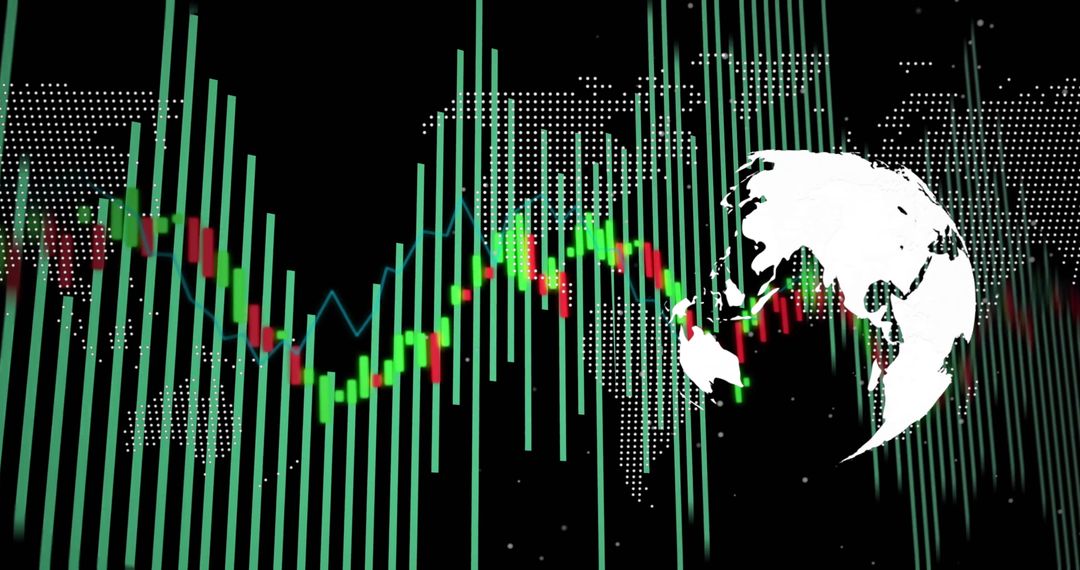
- Abstract Financial Data Analysis on Black Background
Abstract Financial Data Analysis on Black Background Image

This vibrant and abstract representation of financial data showcases colorful bars against a black background, offering a modern look at economic trends and analysis. Ideal for financial websites, blogs about data science, business presentations, or articles on technology-driven changes in global finance. The contrast and color scheme make it suitable for highlighting diverse topics around the modern financial industry.
Powered by  - Get 15% off with code: PIKWIZARD15


2
downloads
downloads
Tags:
More
Credit Photo
If you would like to credit the Photo, here are some ways you can do so
Text Link
photo Link
<span class="text-link">
<span>
<a target="_blank" href=https://pikwizard.com/photo/abstract-financial-data-analysis-on-black-background/a1019406509f9ba1c6c78d416433475f/>PikWizard</a>
</span>
</span>
<span class="image-link">
<span
style="margin: 0 0 20px 0; display: inline-block; vertical-align: middle; width: 100%;"
>
<a
target="_blank"
href="https://pikwizard.com/photo/abstract-financial-data-analysis-on-black-background/a1019406509f9ba1c6c78d416433475f/"
style="text-decoration: none; font-size: 10px; margin: 0;"
>
<img src="https://pikwizard.com/pw/medium/a1019406509f9ba1c6c78d416433475f.jpg" style="margin: 0; width: 100%;" alt="" />
<p style="font-size: 12px; margin: 0;">PikWizard</p>
</a>
</span>
</span>
Free (free of charge)
Free for personal and commercial use.
Author: People Creations
Similar Free Stock Images

Premium


Premium


Premium


Premium


Premium


Premium


Premium


Premium


Premium


Premium


Premium


Premium


Premium


Premium


Premium


Premium


Premium


Premium


Premium


Premium


Premium


Premium


Premium


Premium