- Home >
- Stock Photos >
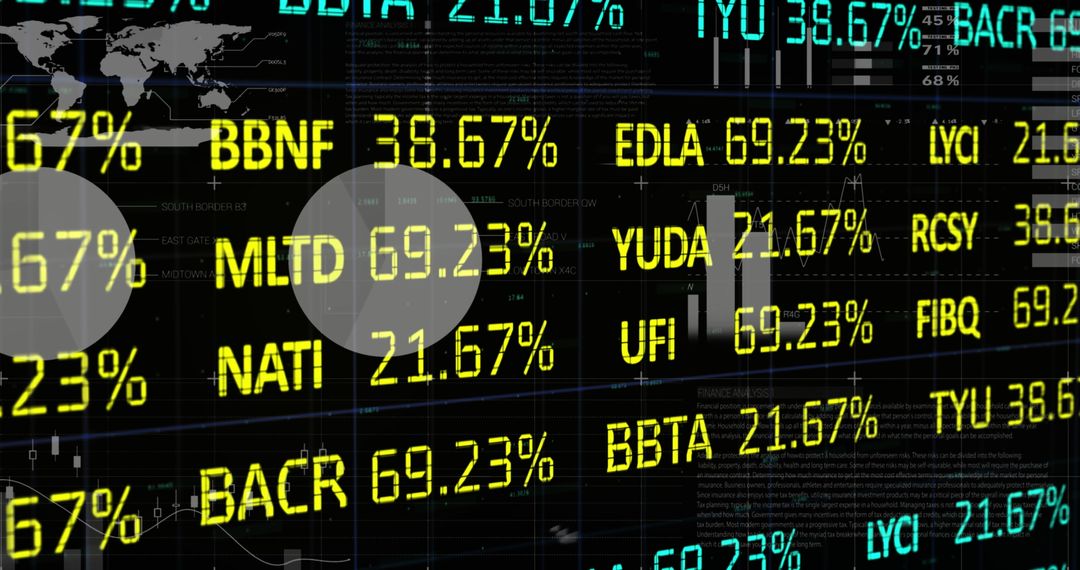
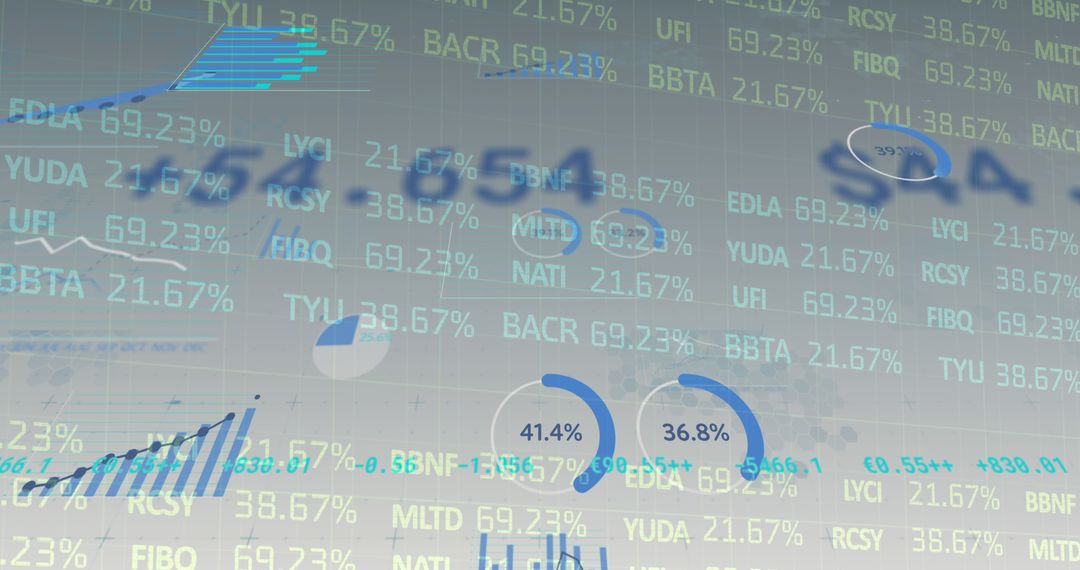
- Abstract Financial Data Analytics and Stock Market Graph
Abstract Financial Data Analytics and Stock Market Graph Image

Vibrant display of financial data with stock values engaging for business presentations or informational articles discussing stock market trends. Useful for illustrating concepts of finance, investment, and economics in digital media or websites dedicated to global stock exchanges.
Powered by 


2
downloads
downloads
Tags:
More
Credit Photo
If you would like to credit the Photo, here are some ways you can do so
Text Link
photo Link
<span class="text-link">
<span>
<a target="_blank" href=https://pikwizard.com/photo/abstract-financial-data-analytics-and-stock-market-graph/75dd0e0a40d5ca41d45b18e7c0742370/>PikWizard</a>
</span>
</span>
<span class="image-link">
<span
style="margin: 0 0 20px 0; display: inline-block; vertical-align: middle; width: 100%;"
>
<a
target="_blank"
href="https://pikwizard.com/photo/abstract-financial-data-analytics-and-stock-market-graph/75dd0e0a40d5ca41d45b18e7c0742370/"
style="text-decoration: none; font-size: 10px; margin: 0;"
>
<img src="https://pikwizard.com/pw/medium/75dd0e0a40d5ca41d45b18e7c0742370.jpg" style="margin: 0; width: 100%;" alt="" />
<p style="font-size: 12px; margin: 0;">PikWizard</p>
</a>
</span>
</span>
Free (free of charge)
Free for personal and commercial use.
Author: Awesome Content
Similar Free Stock Images

Premium


Premium


Premium


Premium


Premium


Premium


Premium


Premium


Premium


Premium


Premium


Premium


Premium


Premium


Premium


Premium


Premium


Premium


Premium


Premium


Premium


Premium


Premium


Premium