- Home >
- Stock Photos >
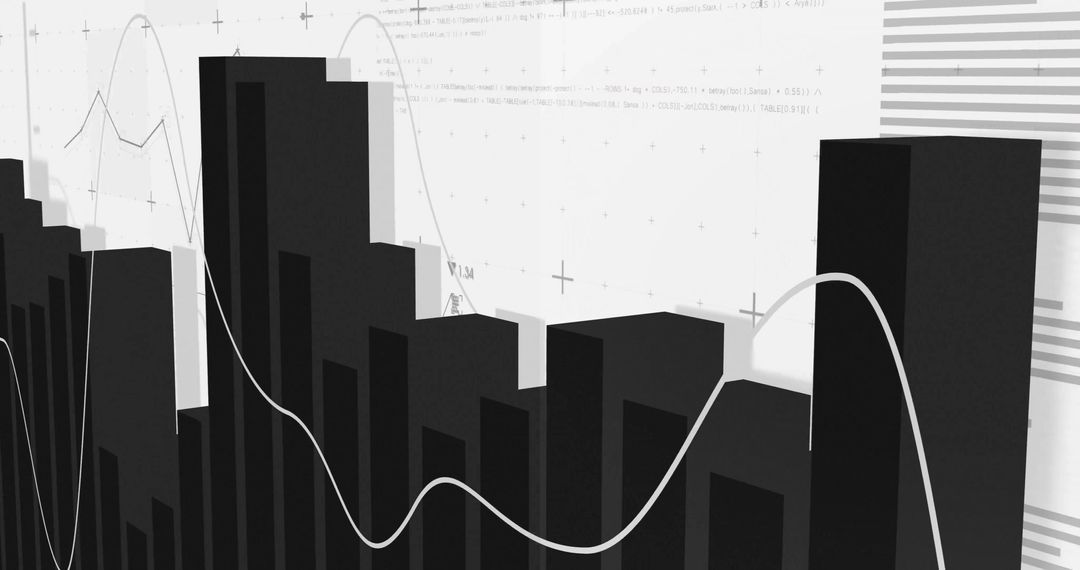
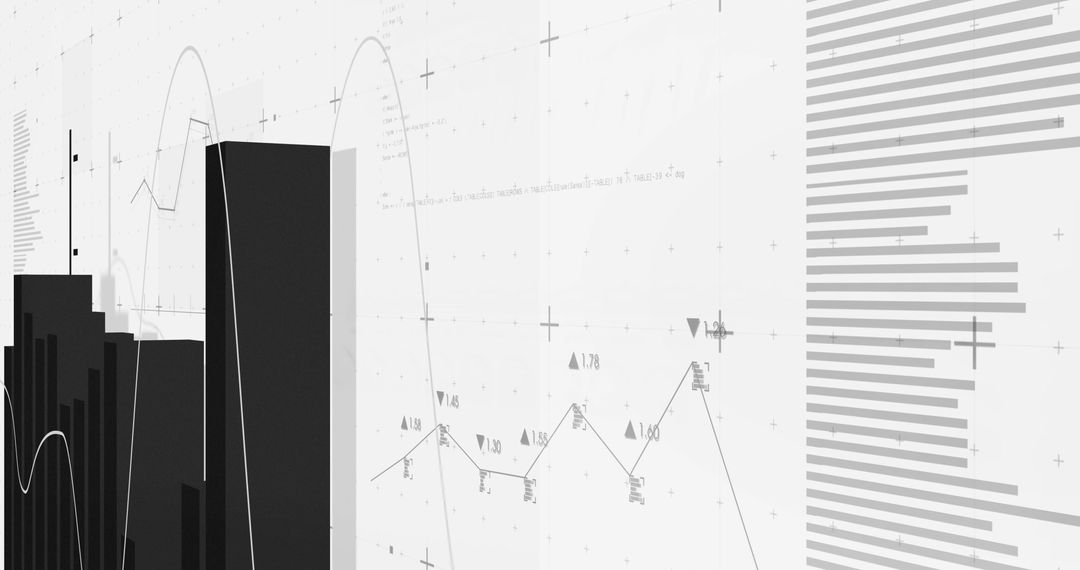
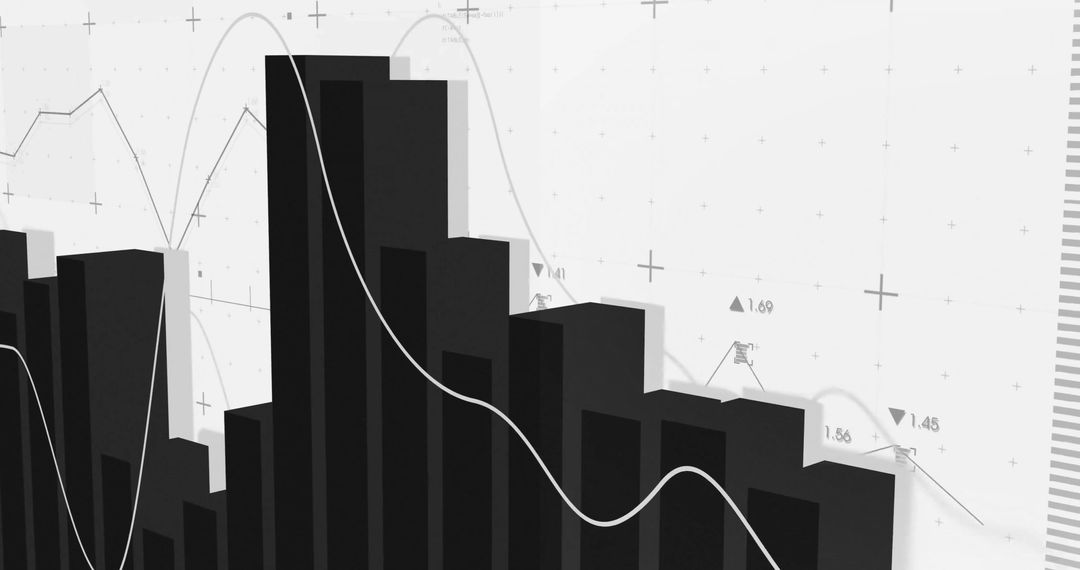
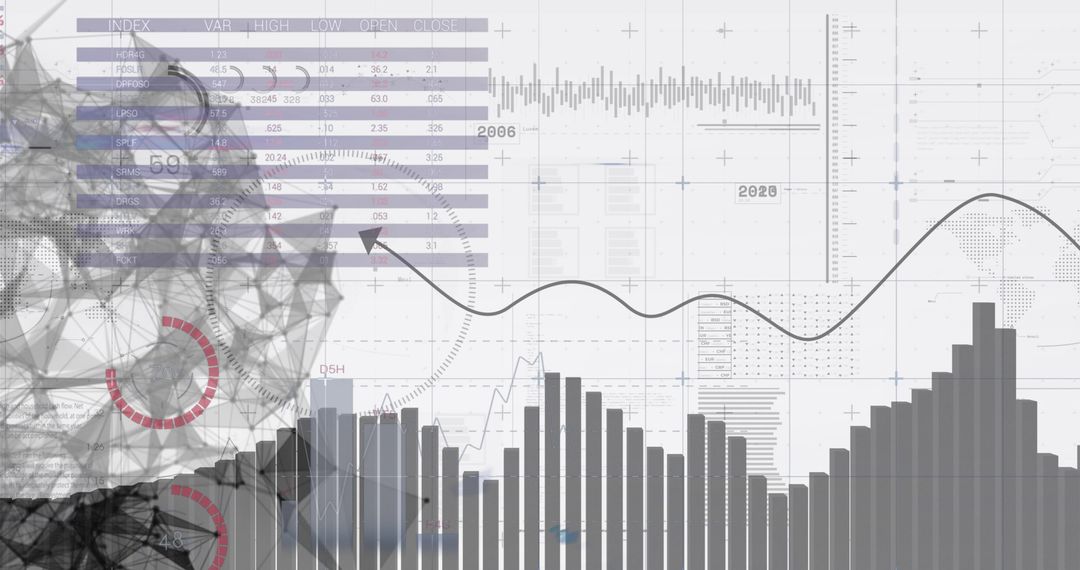
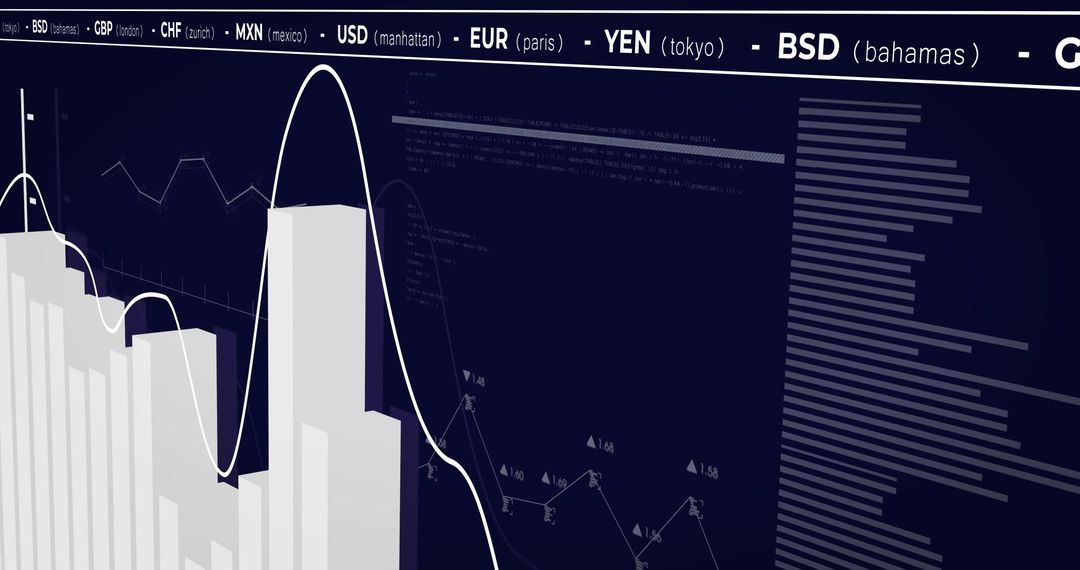
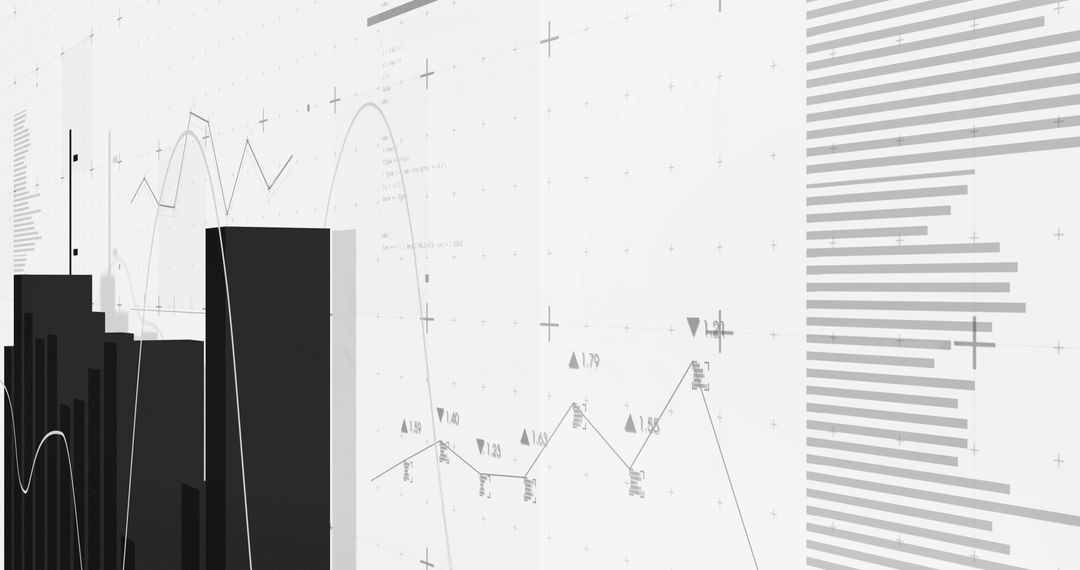
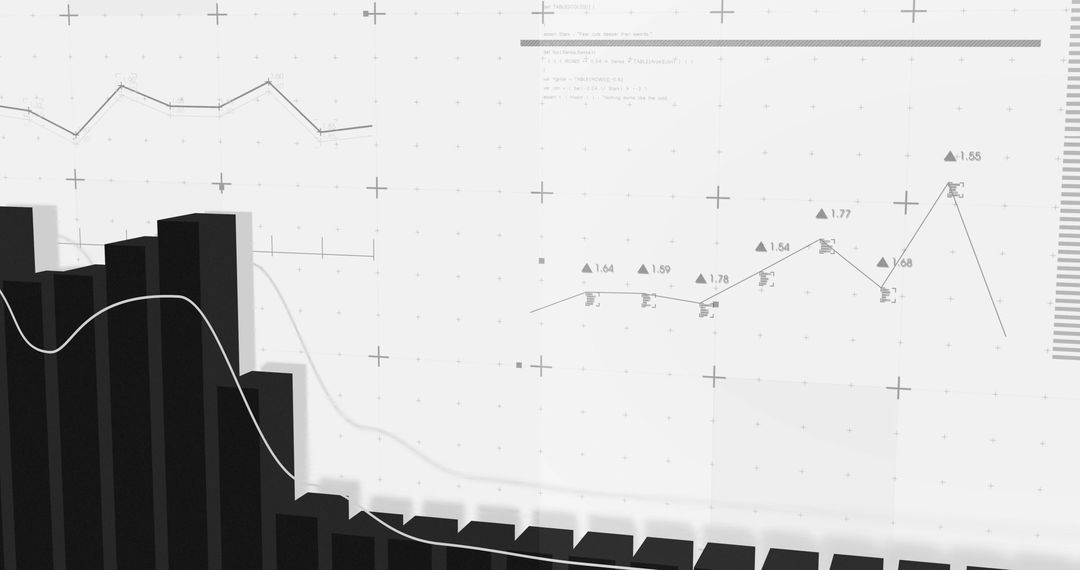
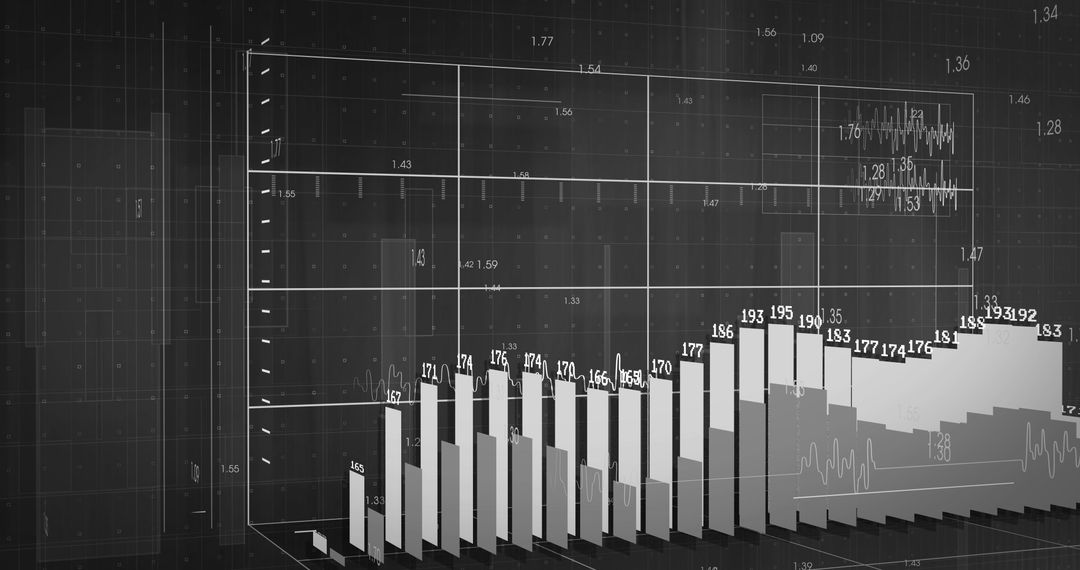
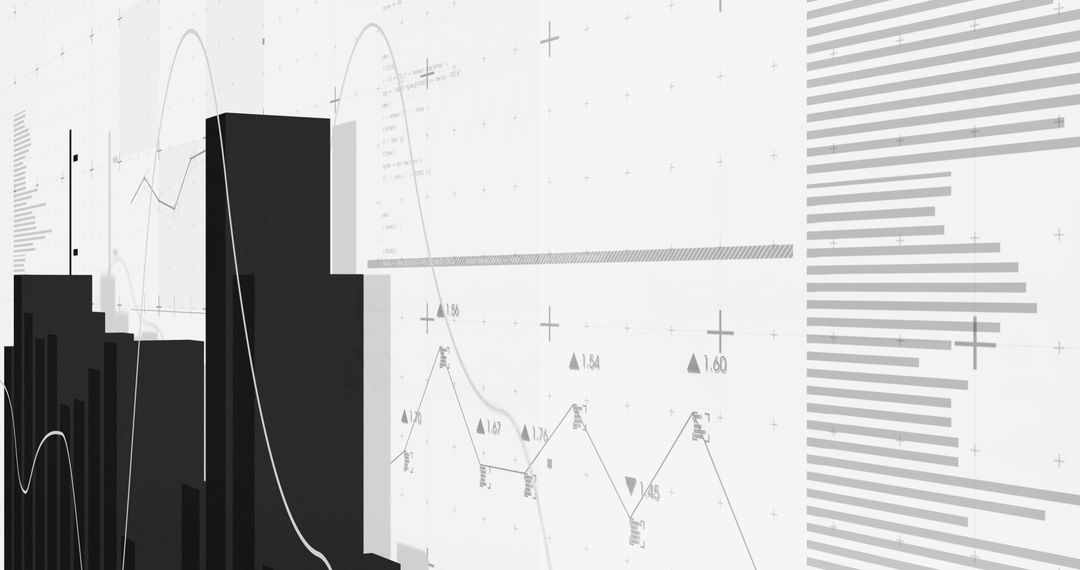
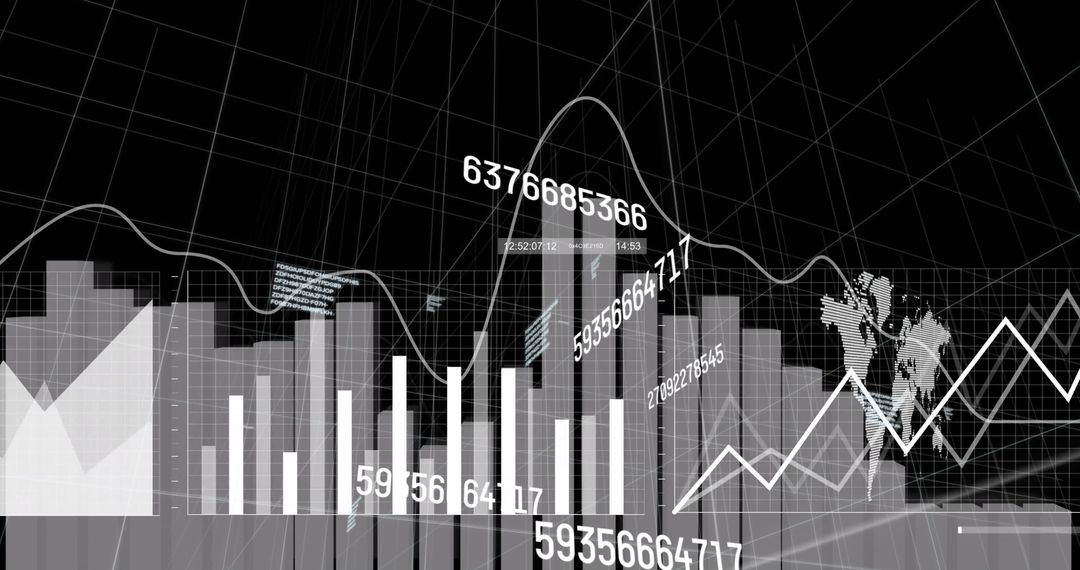
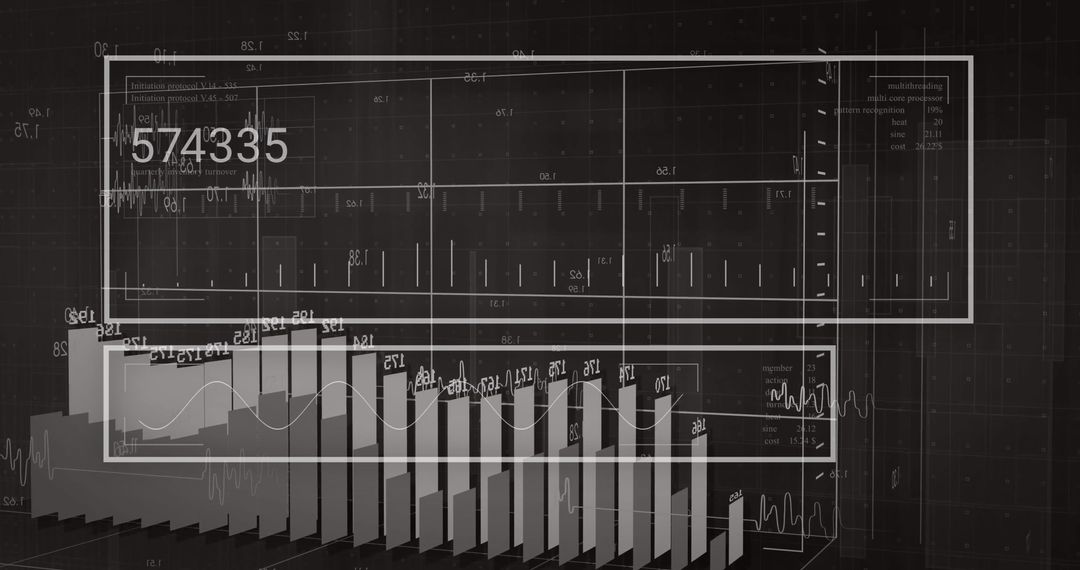
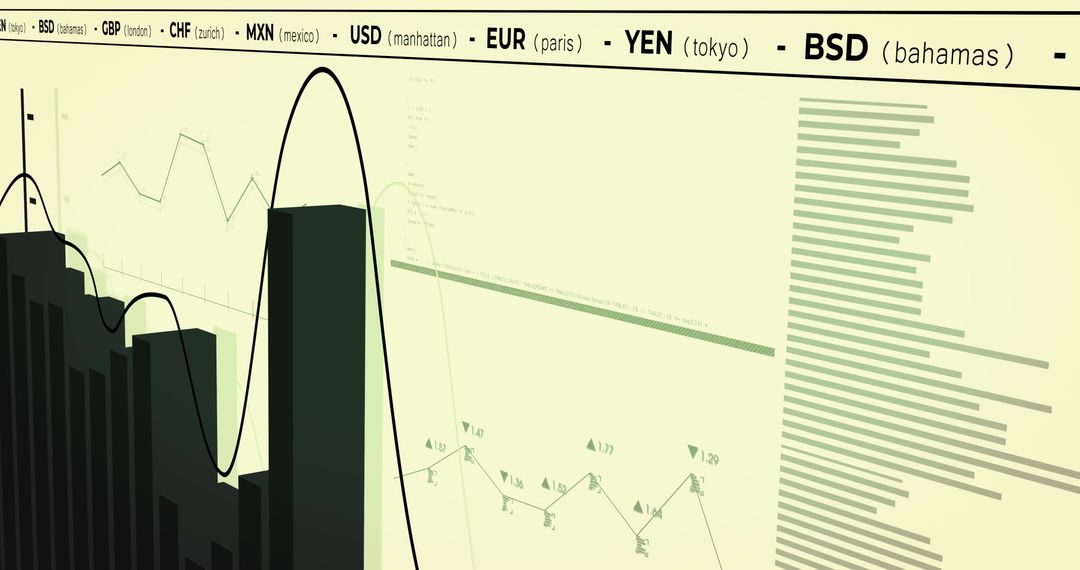
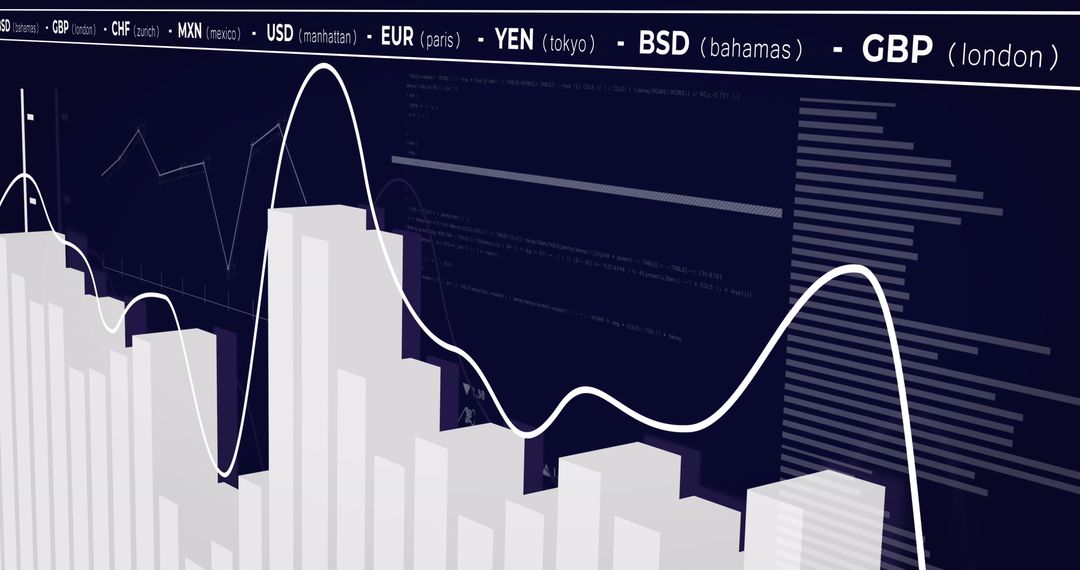
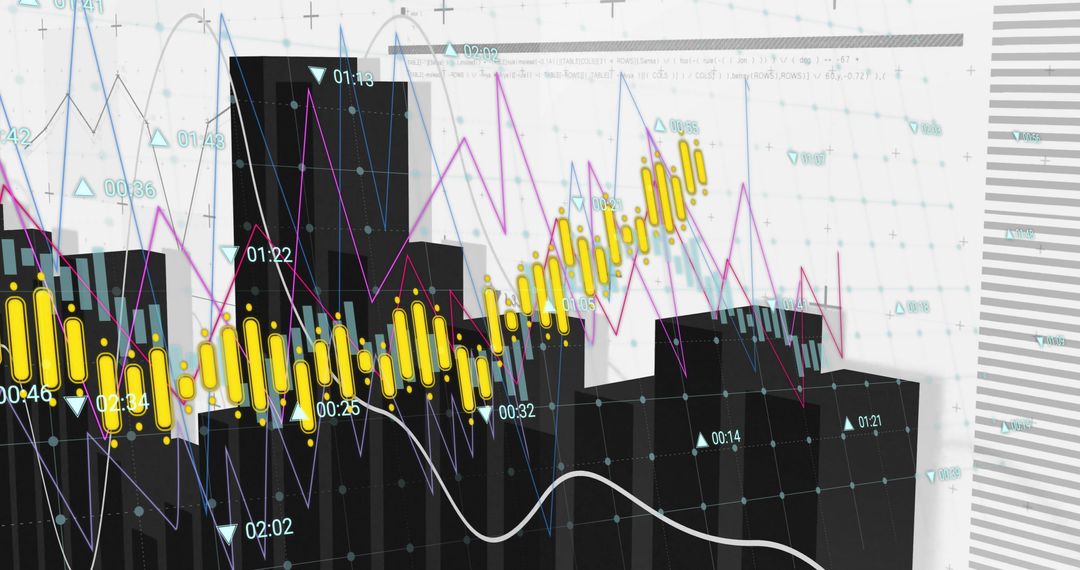
- Abstract Financial Data Bar Graph with Line Chart Overlay
Abstract Financial Data Bar Graph with Line Chart Overlay Image

This abstract representation of financial data features bar graphs and line charts on a white background, visually depicting statistical trends and economic information. Ideal for presentations, business reports, and websites focusing on business analytics, financial forecasting, and economic research, this digital illustration conveys modern data processing dynamics in a visually engaging manner.
Powered by  - Get 15% off with code: PIKWIZARD15


2
downloads
downloads
Tags:
More
Credit Photo
If you would like to credit the Photo, here are some ways you can do so
Text Link
photo Link
<span class="text-link">
<span>
<a target="_blank" href=https://pikwizard.com/photo/abstract-financial-data-bar-graph-with-line-chart-overlay/94cddc59292692bd9eaf9fa93af7a4bb/>PikWizard</a>
</span>
</span>
<span class="image-link">
<span
style="margin: 0 0 20px 0; display: inline-block; vertical-align: middle; width: 100%;"
>
<a
target="_blank"
href="https://pikwizard.com/photo/abstract-financial-data-bar-graph-with-line-chart-overlay/94cddc59292692bd9eaf9fa93af7a4bb/"
style="text-decoration: none; font-size: 10px; margin: 0;"
>
<img src="https://pikwizard.com/pw/medium/94cddc59292692bd9eaf9fa93af7a4bb.jpg" style="margin: 0; width: 100%;" alt="" />
<p style="font-size: 12px; margin: 0;">PikWizard</p>
</a>
</span>
</span>
Free (free of charge)
Free for personal and commercial use.
Author: People Creations
Similar Free Stock Images

Premium

Premium


Premium


Premium


Premium


Premium


Premium


Premium


Premium


Premium


Premium


Premium


Premium


Premium


Premium


Premium


Premium


Premium


Premium


Premium


Premium


Premium


Premium


Premium


Premium