1. Home > 
  2. Stock Photos > 
  3. Abstract Financial Data Display with Blue Digital Graphs

Abstract Financial Data Display with Blue Digital Graphs Image

Abstract Financial Data Display with Blue Digital Graphs

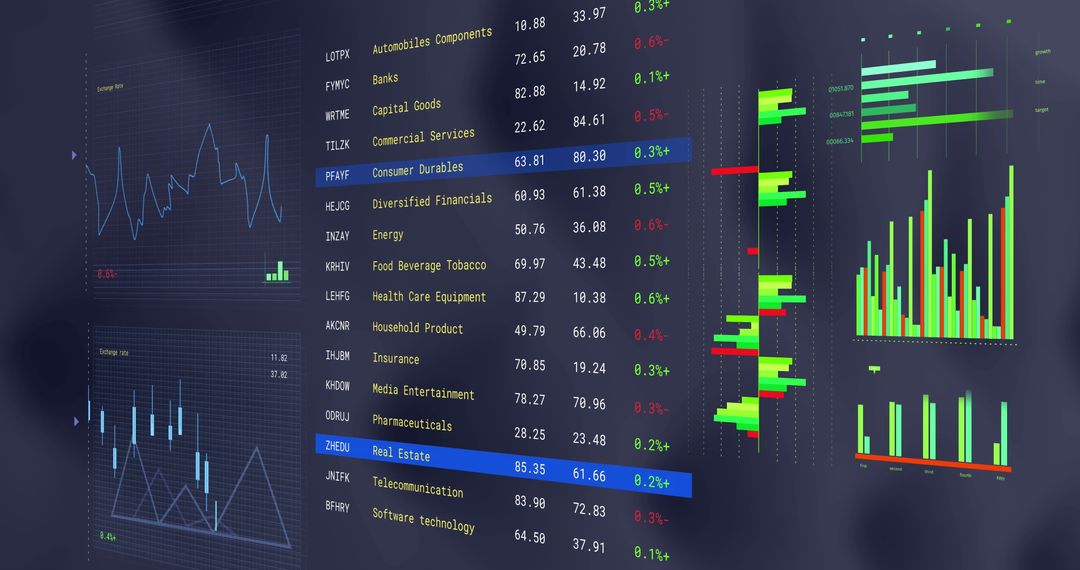
This image features an abstract representation of financial data and digital graphs with blue details over a dark background. It conveys a sense of modern technology and the dynamic nature of business finance. Useful for articles or presentations related to market analysis, financial technology, data processing, or corporate finance.

Powered by Adobe logo
Financial market data analysis with glowing 3D bar and line charts on dark background showing economic trends and growth concept visualization. 3D Rendering - Powered by AdobeAbstract representation of financial growth with glowing graphs and data patterns in dark background - Powered by AdobeAdvanced robotic assistants working in a modern office analyzing financial data on computer screens with stock market graphs - Powered by AdobeMan analyzing financial data on multiple screens - Powered by AdobeLarge screen display showing various business graphs and charts. - Powered by Adobe

Credit Photo

If you would like to credit the Photo, here are some ways you can do so

Free (free of charge)

Free for personal and commercial use.

Author: People Creations

Similar Free Stock Images

Dynamic Stock Market Ticker Display with Financial Graphs
Premium
abstract colorful bar graph showing business growth and financial success with data analysis and market trends for corporate presentation and website
Dynamic Stock Market Ticker and Graph Analysis
Confetti Falling Over Digital Stock Market Data Visualization
Financial Charts and Data Interfaces on Blue Background
Digital Graphs Displaying Financial and Statistical Data on Blue Grid
Premium
Financial data graph with rising and falling trends in vibrant colors
Genomic Data and Digital Interface Conceptual Display
Dynamic Stock Market Analysis Numbers and Graphs
Financial Data and Chemical Structures Intertwine on Digital Grid
Financial Data Analysis Overlaid on Digital Background
Premium
Digital glowing stock market chart with options trend and index data on a dark background, symbolizing economic growth, trading, and financial technology.
Dynamic Financial Graphs and Data in Digital Abstract
Financial Data Visualization with Stock Numbers and Charts
Dynamic Visualization of Financial Data on Digital Interface
Digital Display of Economic Graphs and Financial Data
Premium
Growth business strategy..Transparent stock market chart  investment trading graph growth.Trade business analytics graph and financial chart.
Global Digital Interface with Interactive Data Visualization
Abstract Stock Market Data Innovation with Bar and Line Graphs
Dynamic Financial Market Data and Business Technology Concept
Global Data Processing with Digital Maps and Graphs
Premium
Hand interacting with financial data on a digital screen showing stock market graphs
Futuristic Digital Data Analysis Interface on Black Background
Digital Display of Stock Market Data with Neon Elements
Dynamic Stock Market Graphs Showing Fluctuating Trends
Dynamic Financial Data on Grid Background
Premium
Digital stock market display with glowing blue and orange graphs and data lines, reflecting on shiny floor, conveys futuristic financial environment
Digital Finance Data and Statistical Graphs on Dark Background
Dynamic Data Visualization in Abstract Digital Interface
Global Financial Data Analysis with Digital World Map Visualization
Digital Data Visualization on Global World Map
Dynamic Stock Market Ticker Against Code Background
Digital Charts and Graphs Display for Finance and Statistics
Premium
Dynamic digital financial graph with glowing purple and blue trend lines on dark background displaying market analytics data for investment technology
Data Analysis Visual with Infographics and Charts
Digital Financial Data and Stock Market Trends on Screen
Dynamic Financial Data and Analytics Display
Financial Data with Graphs on Digital Display
Premium
Professional Latina woman sits at desk in coworking office, focused on her work, looking at computer screen displaying financial charts and stock market data related to trading or financial analysis
Dynamic Financial Data Showing Stock Market Trends Concept
Digital Financial Analytics Merging with Chemical Data
Financial Data Analysis with Graphs and Charts in Blue
Digital Analytics Data on Virtual Screen Background
Premium
Golden coin stacks on a reflective surface against a glowing blue digital stock market graph. Business finance, investment, and economic growth concept with abstract bokeh background.
Global Financial Data Visual Representation with World Map Overlay
Dynamic Financial Data Streams and Global Networks
Global Financial Data Analysis Over World Map Visualization
Digital Data Processing and Analysis on Dark Interface
Premium
Green graph line rising on bar chart. Stock market price growth, financial profit success in investment business.
Financial Data Visualization with Dynamic Chart and Graph Display
Dynamic Stock Market Analysis with Blue Graphs and Percentages
Global Financial Data with Graphs and World Map Visualization
Global Data Visualization with Digital World Map and Graphs
Premium
A businessman in a suit watches stock market data on a large monitor in a modern office while analyzing financial graphs and charts displayed.
Abstract Financial Data Visualization With Graphs and Numbers
Financial Data and Stock Market Analysis with Cityscape
Data Processing and Analytics in Digital Grid Space
Dynamic Financial Graphs and Data Fluctuations
Premium
Business goal setting and strategic planning. professional analyzing financial reports and business analytics, with a glowing target and performance tracking in corporate strategy
Analyzing Complex Financial Data in Digital Display
Digital Financial Data Visualization Over Dark Background
Digital Data Analysis with Financial Charts and Graphs
Dynamic Financial Display with Real-Time Stock Data and Graphs
Dynamic Financial Data and Stock Market Interface
Global Data Analytics with World Map and Bar Graph
Premium
A business professional scrutinizes financial data on a keyboard, with digital graphs illuminating stock market trends and analysis in a modern office environment. Scalp
Financial Data Chart with Dynamic Graphs and Stats Display
Advanced Financial Data Visualization on Digital Interface
Digital Financial Data Over Cityscape Background: Global Economy Concept
Futuristic Digital Data Analysis with Graph Analytics
Premium
Digital finance stock market graphs illustrate a technological business board with abstract blue circuit data.
Dynamic Financial Charts on Global Digital Grid Background
Financial Data Processing in High-Tech Environment
Dynamic Financial Data Processing Display with Charts
Financial Data Analysis with Abstract Graphics
Premium
Dynamic glowing green stock market graph ascends, symbolizing financial growth and positive economic trends with bokeh lights.
Digital Financial Analysis with Soaring Graphs and Statistics
Financial Data Display on Digital Screen Representing Market Trends
Dynamic Financial Data Overlay on Busy City Street Background
Digital Stock Market Interface with data Graphs and Chart
Premium
Investing and stock market concept gain and profits with faded candlestick charts, digital display representing financial market data and trends. The foreground features prominent green and red
Stock Market Trends and Data Visualization in Digital Interface
Stock Market Data Analysis with Digital Interface Elements
Digital Financial Analysis with Real-Time Stock Market Data
Abstract Financial Data Analysis with Charts and Figures
Premium
Drive your business growth like a pro with data-driven insights for financial success and prosperity
Financial Graphs Displayed Over Aerial City View
Digital Data Processing Background with Floating Code and Grid
Dynamic Financial Data and Graph Analysis on Digital Display
Dynamic Stock Market Data and Charts on Digital Interface
Premium
A financial analyst interacting with an AI algorithm for high-frequency trading and risk assessment, multiple monitors displaying complex graphs and stock market data, tense atmosphere
Digital Coding and Financial Stock Market Graph Analysis
Global Data Visualization with World Map and Business Charts
Digital Data Visualization Across Cosmic Background
Dynamic Stock Market Ticker Display with Rising and Falling Graphs
Abstract Financial Data and Graph Analysis on Digital Screen
Data Analytics and Statistics Display Over Digital Interface
Premium
Financial market crash with red downward arrow and graphs indicating global economic recession and business investment losses on digital screen.
Complex Data Processing Interface with Digital Code Overlay
DNA Strands Overlay on Digital Data Analysis Graph
Virtual Data Streams and Analytics Interface
Stock Market Data Streaming Over Dark Background
Premium
A close-up, macro shot of a black pen tip touching a red line on a digital screen displaying stock market data with green and orange glowing elements and bokeh
Digital Financial Data Analysis Over Modern Server Center
Digital Financial Data Visualization with Dynamic Charts
Dynamic Financial Data Chart with Floating Numbers
Dynamic Financial Data Processing with Global Networks Interface
Premium
Laptop screen displaying financial charts
Digital Financial Data Analysis with Stock Market Insights
Digital Stock Market Data Visuals with Numbers and Graphs
Analyzing Financial Data with Abstract Technological Background
Abstract Financial Data on Digital Graph Background
Premium
Businessman analyzing financial data on futuristic digital screen with graphs and charts on a dark background, showcasing the finance growth concept.
Financial Growth Graph Over Urban Skyline with Currencies
Dynamic Digital Data Display with Graphs and Numbers
Digital Financial Data and Analysis with Graphs
Financial Data Information with Graphs and Charts for Stock Market Analysis
Premium
futuristic glowing blue arrows upward on digital background for web design tech branding business growth data concept abstract graphic illustration
Financial Data Analysis with Stock Market Graphs
Dynamic Financial Data Overlaid on Digital Grid
Data Processing with Digital Interface and Code Background
Futuristic Financial Data Display with Charts and Graphs
Premium
Businessman using laptop computer analyzing sales data, financial growth graph chart report. Data analysis with Ai technology. Business planning, strategy and development, Accounting. market research
Global Finances and Data Analysis with World Map Overlay