- Home >
- Stock Photos >
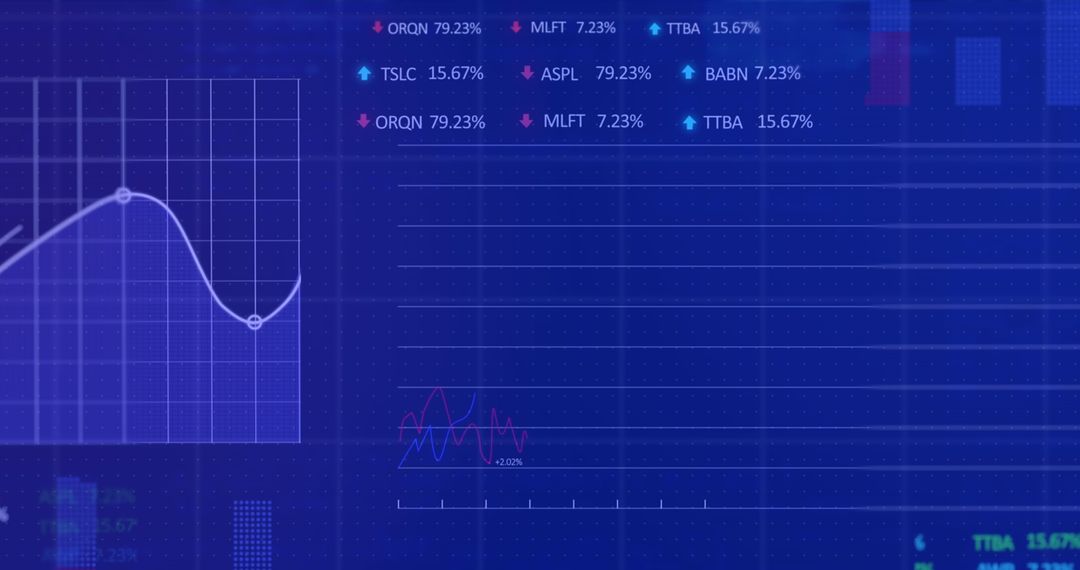
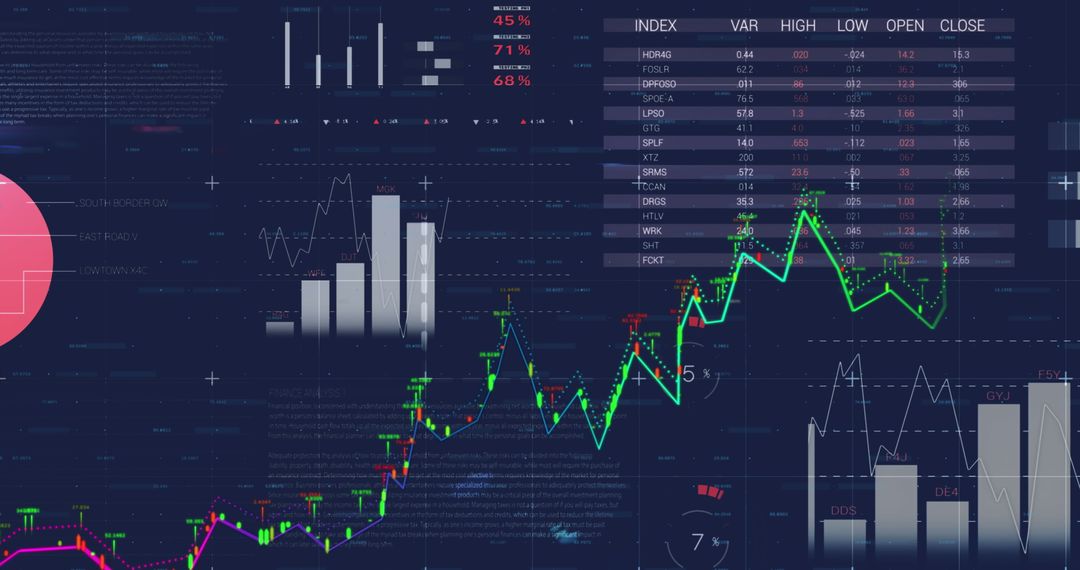
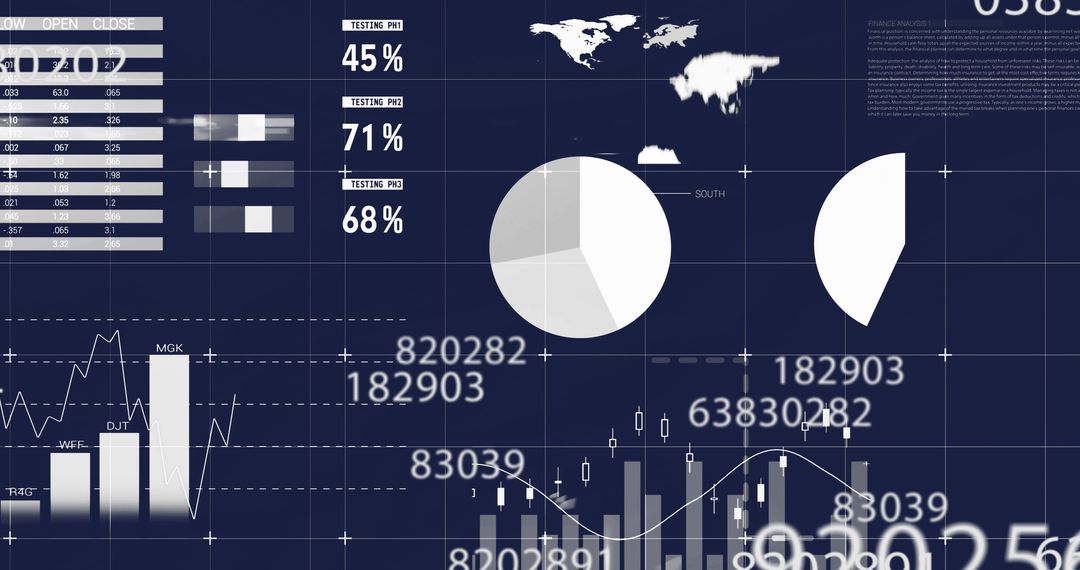
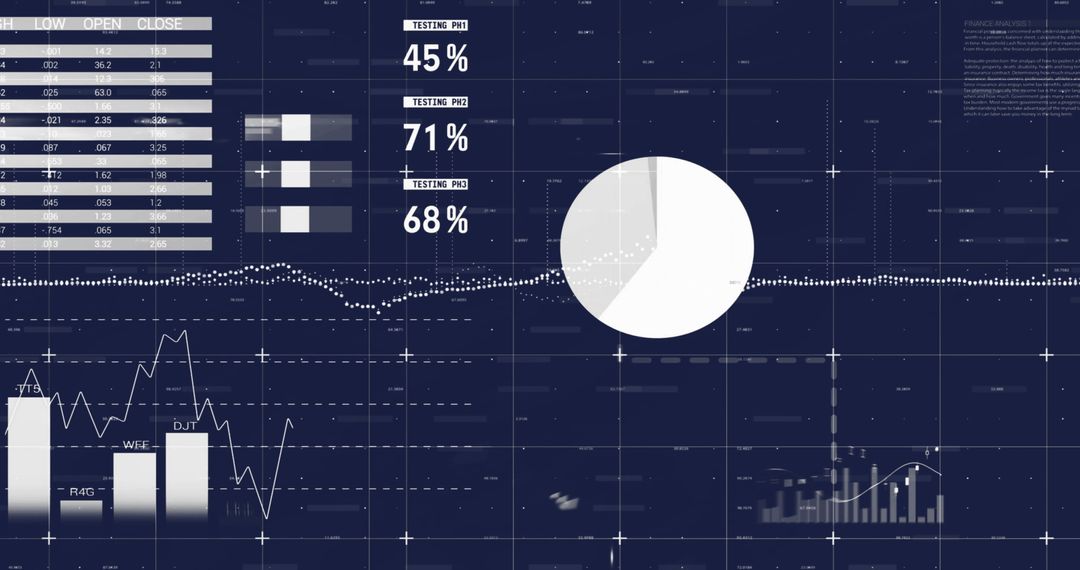
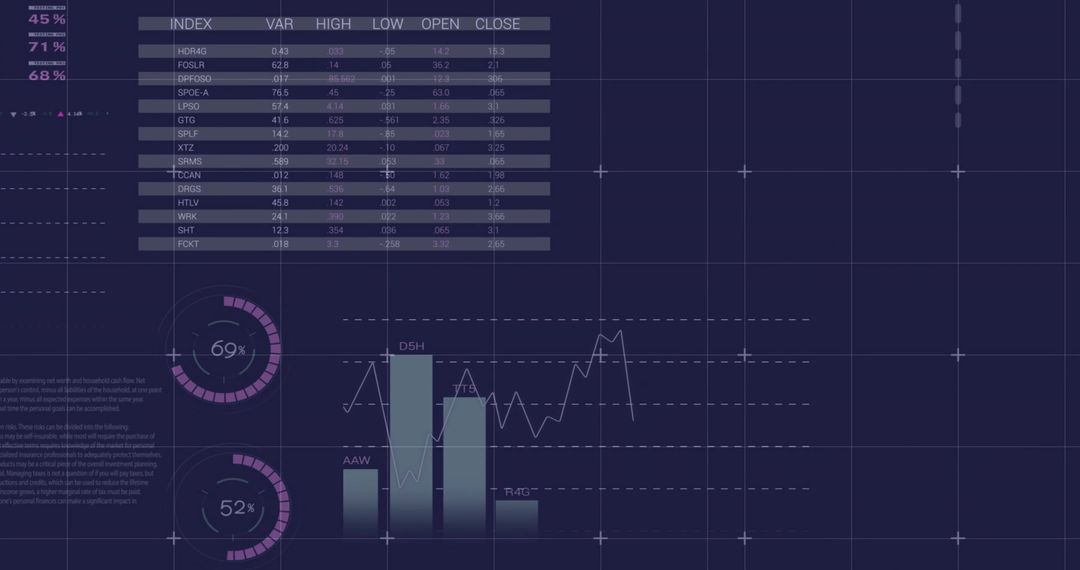
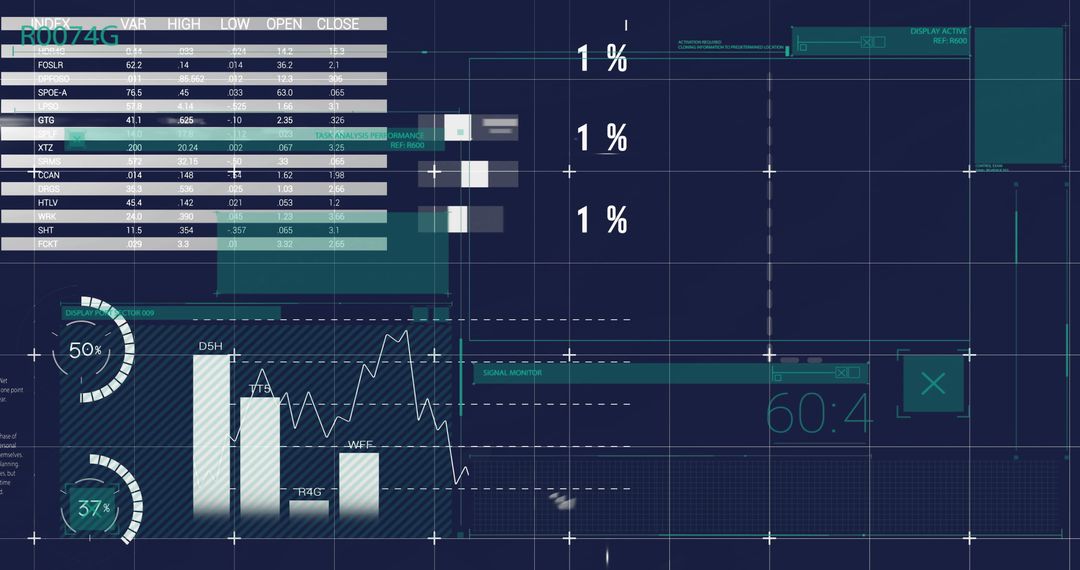
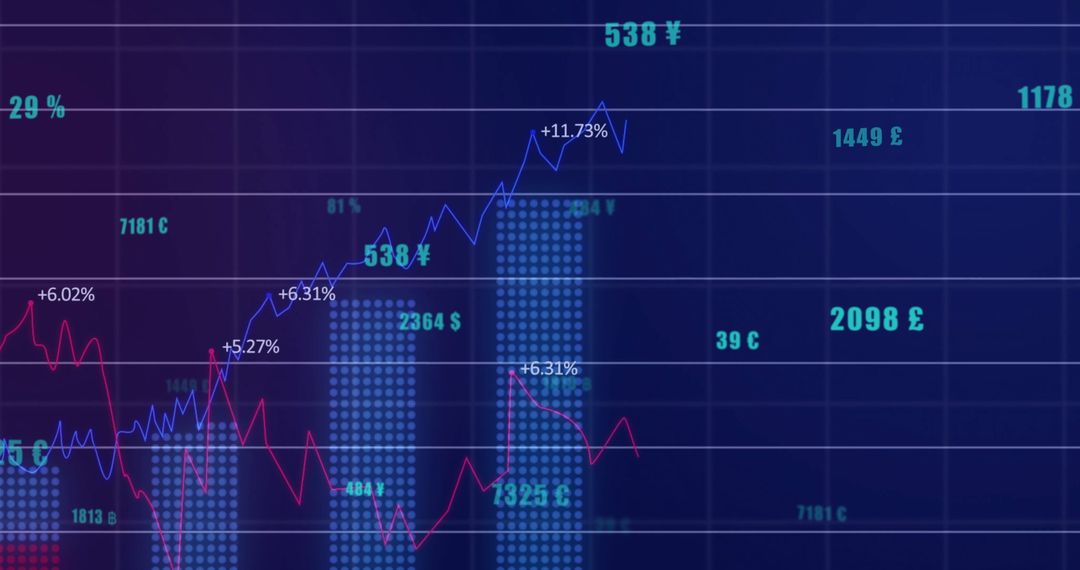
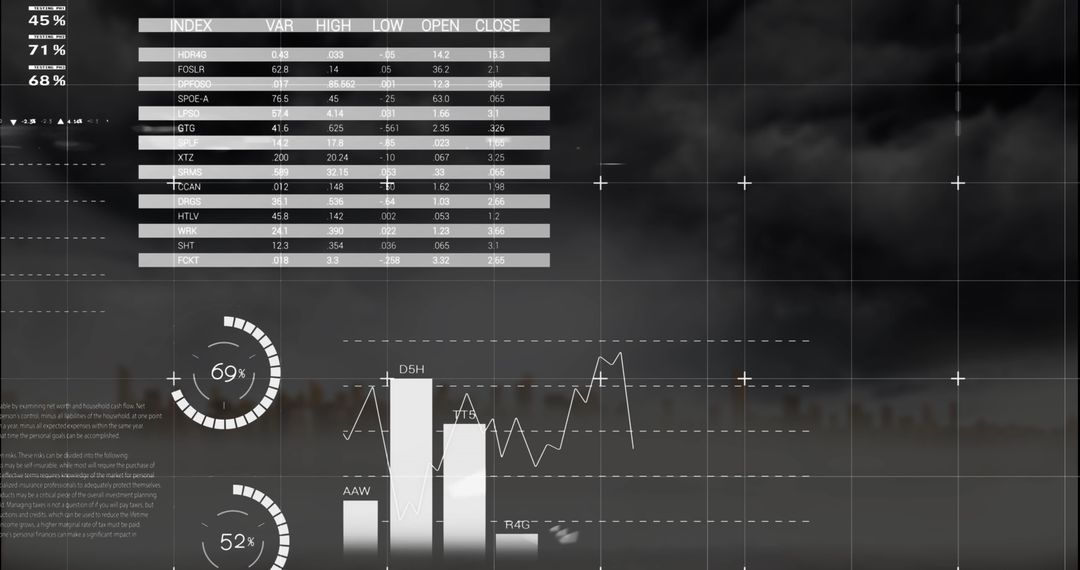
- Abstract Financial Data Interface with Graphs and Percentages
Abstract Financial Data Interface with Graphs and Percentages Image

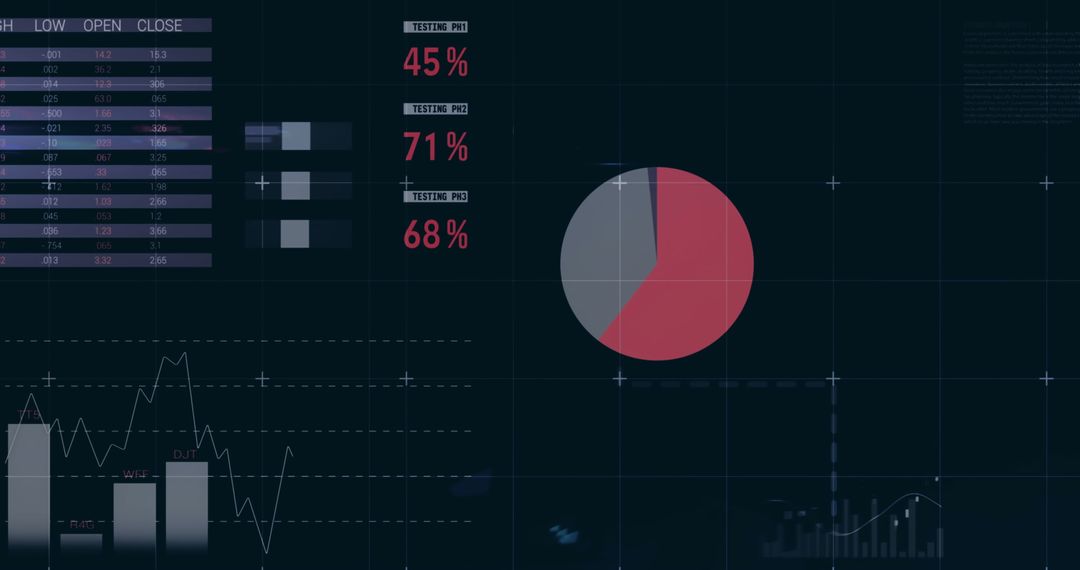
Abstract visualization focuses on financial data and technology concepts with various graphs, percentages, and data points on a blue grid background. Suitable for use in finance and technology presentations, business reports, and digital marketing materials emphasizing innovation and data analysis.
Powered by  - Get 15% off with code: PIKWIZARD15


0
downloads
downloads
Tags:
More
Credit Photo
If you would like to credit the Photo, here are some ways you can do so
Text Link
photo Link
<span class="text-link">
<span>
<a target="_blank" href=https://pikwizard.com/photo/abstract-financial-data-interface-with-graphs-and-percentages/920aecf96015677912836ef95f6eb63f/>PikWizard</a>
</span>
</span>
<span class="image-link">
<span
style="margin: 0 0 20px 0; display: inline-block; vertical-align: middle; width: 100%;"
>
<a
target="_blank"
href="https://pikwizard.com/photo/abstract-financial-data-interface-with-graphs-and-percentages/920aecf96015677912836ef95f6eb63f/"
style="text-decoration: none; font-size: 10px; margin: 0;"
>
<img src="https://pikwizard.com/pw/medium/920aecf96015677912836ef95f6eb63f.jpg" style="margin: 0; width: 100%;" alt="" />
<p style="font-size: 12px; margin: 0;">PikWizard</p>
</a>
</span>
</span>
Free (free of charge)
Free for personal and commercial use.
Author: People Creations
Similar Free Stock Images

Premium


Premium


Premium


Premium


Premium


Premium


Premium


Premium


Premium


Premium


Premium


Premium


Premium


Premium


Premium


Premium


Premium


Premium


Premium


Premium


Premium


Premium


Premium


Premium