- Home >
- Stock Photos >
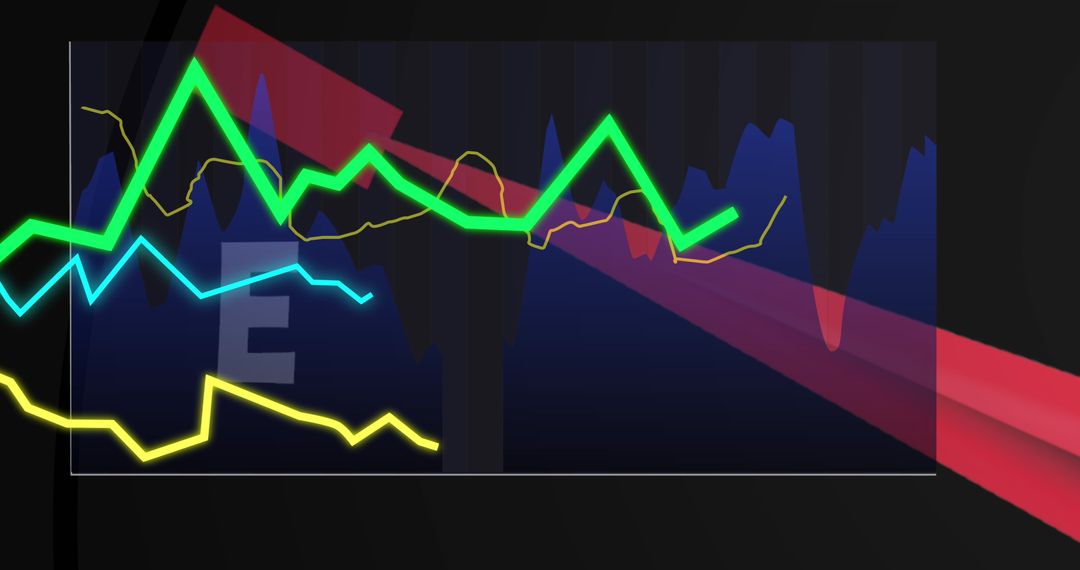
- Abstract Financial Data Line Chart on Colored Background
Abstract Financial Data Line Chart on Colored Background Image

This stylized line chart portrays fluctuating market data, delineated by red and green segments, combined with data markers on a gradient background. It offers a visual insight into stock market trends and financial statistics, ideal for illustrating articles about finance, investment strategies, and market analysis. This stock visualization can be an asset for presentations in business, educational materials relating to digital trading or analytics seminars text covers when working on technologocal aspects investments.
Powered by 


2
downloads
downloads
Tags:
More
Credit Photo
If you would like to credit the Photo, here are some ways you can do so
Text Link
photo Link
<span class="text-link">
<span>
<a target="_blank" href=https://pikwizard.com/photo/abstract-financial-data-line-chart-on-colored-background/730e850af17d8cab54847596d9bdad30/>PikWizard</a>
</span>
</span>
<span class="image-link">
<span
style="margin: 0 0 20px 0; display: inline-block; vertical-align: middle; width: 100%;"
>
<a
target="_blank"
href="https://pikwizard.com/photo/abstract-financial-data-line-chart-on-colored-background/730e850af17d8cab54847596d9bdad30/"
style="text-decoration: none; font-size: 10px; margin: 0;"
>
<img src="https://pikwizard.com/pw/medium/730e850af17d8cab54847596d9bdad30.jpg" style="margin: 0; width: 100%;" alt="" />
<p style="font-size: 12px; margin: 0;">PikWizard</p>
</a>
</span>
</span>
Free (free of charge)
Free for personal and commercial use.
Author: Creative Art