
- Home >
- Stock Photos >
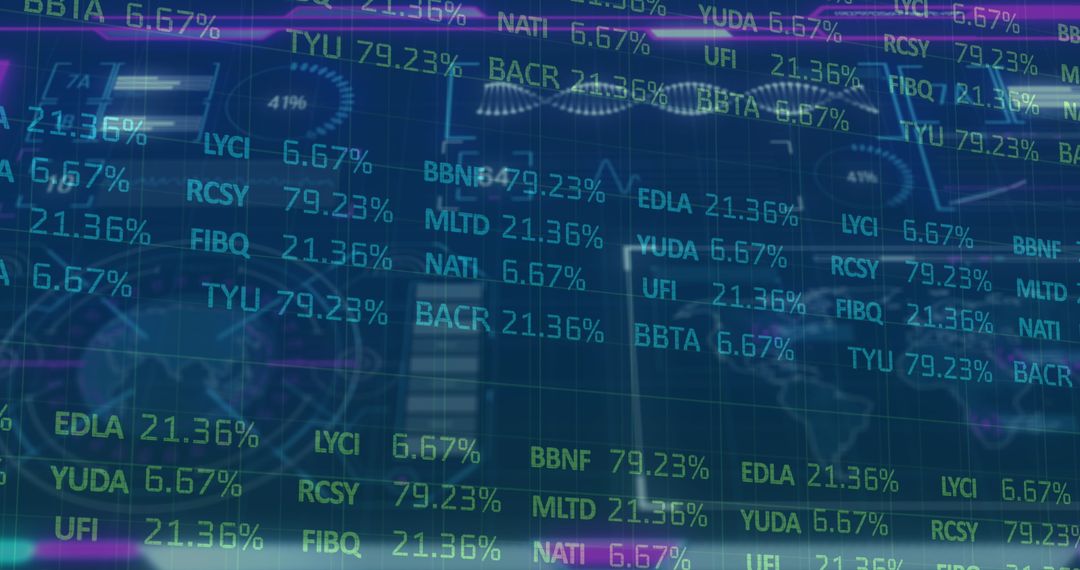
- Abstract Financial Display with Stock Tickerts and Analytics
Abstract Financial Display with Stock Tickerts and Analytics Image

This abstract visualization of stock tickers and percentages overlaid with line charts is ideal for financial and investment-themed articles, presentations, or business-related websites. The image showcases a blend of modern technology and business, making it suitable for conveying themes of finance, economics, and big data analysis. Useful for illustrating forward-thinking business strategies and innovative analytics solutions.
Powered by 


2
downloads
downloads
Tags:
More
Credit Photo
If you would like to credit the Photo, here are some ways you can do so
Text Link
photo Link
<span class="text-link">
<span>
<a target="_blank" href=https://pikwizard.com/photo/abstract-financial-display-with-stock-tickerts-and-analytics/d3c115b0ee44b9473ebdd3fe8b88d046/>PikWizard</a>
</span>
</span>
<span class="image-link">
<span
style="margin: 0 0 20px 0; display: inline-block; vertical-align: middle; width: 100%;"
>
<a
target="_blank"
href="https://pikwizard.com/photo/abstract-financial-display-with-stock-tickerts-and-analytics/d3c115b0ee44b9473ebdd3fe8b88d046/"
style="text-decoration: none; font-size: 10px; margin: 0;"
>
<img src="https://pikwizard.com/pw/medium/d3c115b0ee44b9473ebdd3fe8b88d046.jpg" style="margin: 0; width: 100%;" alt="" />
<p style="font-size: 12px; margin: 0;">PikWizard</p>
</a>
</span>
</span>
Free (free of charge)
Free for personal and commercial use.
Author: Awesome Content
Similar Free Stock Images

Premium


Premium


Premium


Premium


Premium


Premium


Premium


Premium


Premium


Premium


Premium


Premium


Premium


Premium


Premium


Premium


Premium


Premium


Premium


Premium


Premium


Premium


Premium


Premium

