
- Home >
- Stock Photos >
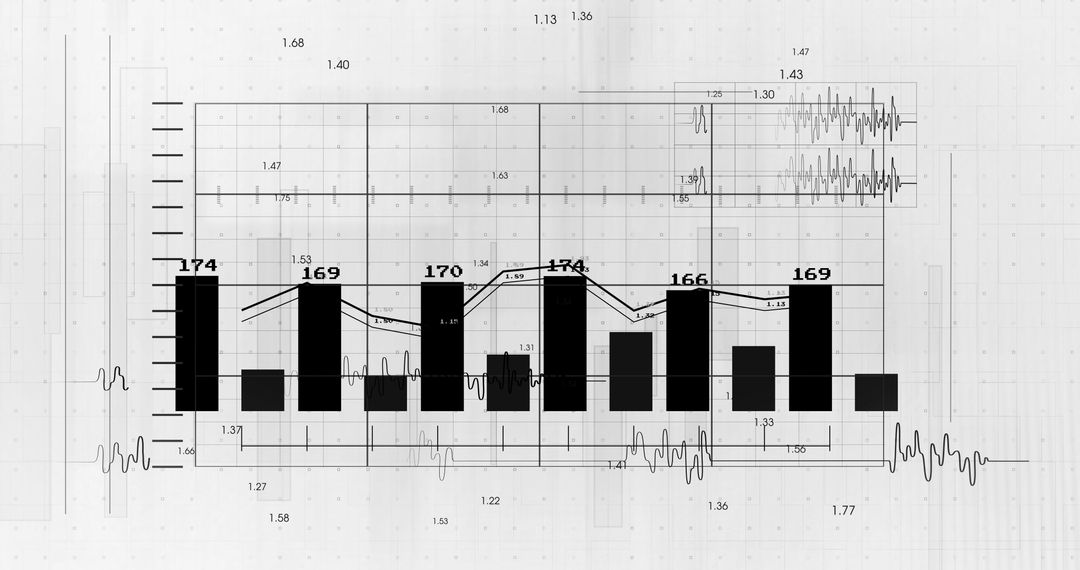
- Abstract Financial Graph and Data Analysis on White Background
Abstract Financial Graph and Data Analysis on White Background Image

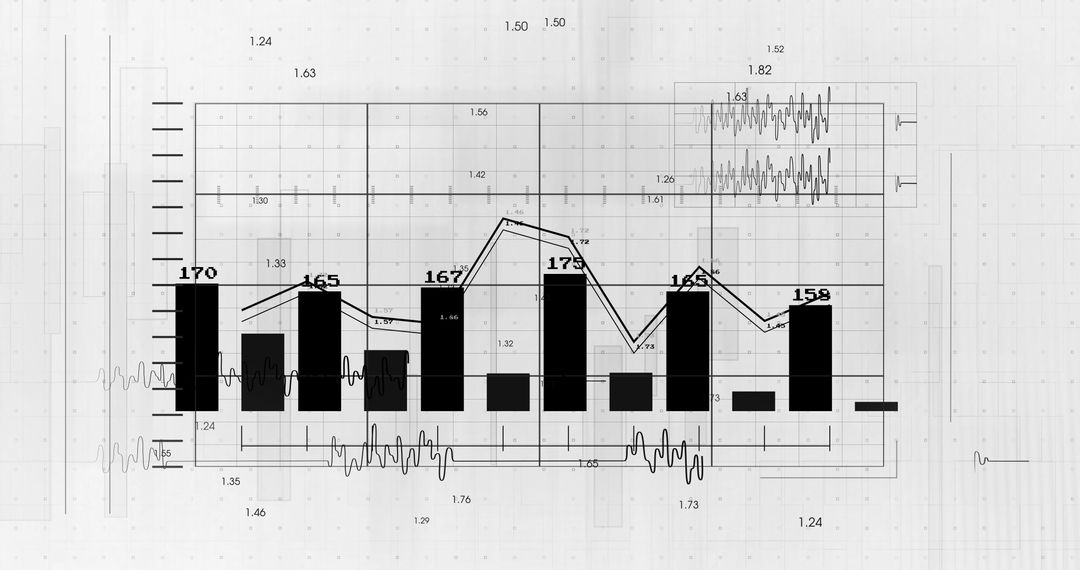
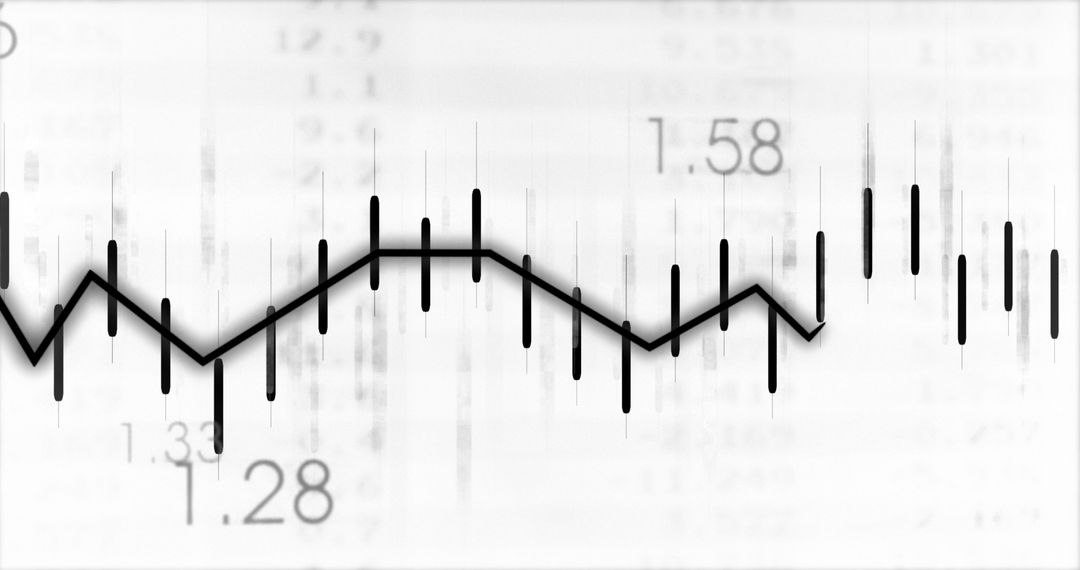
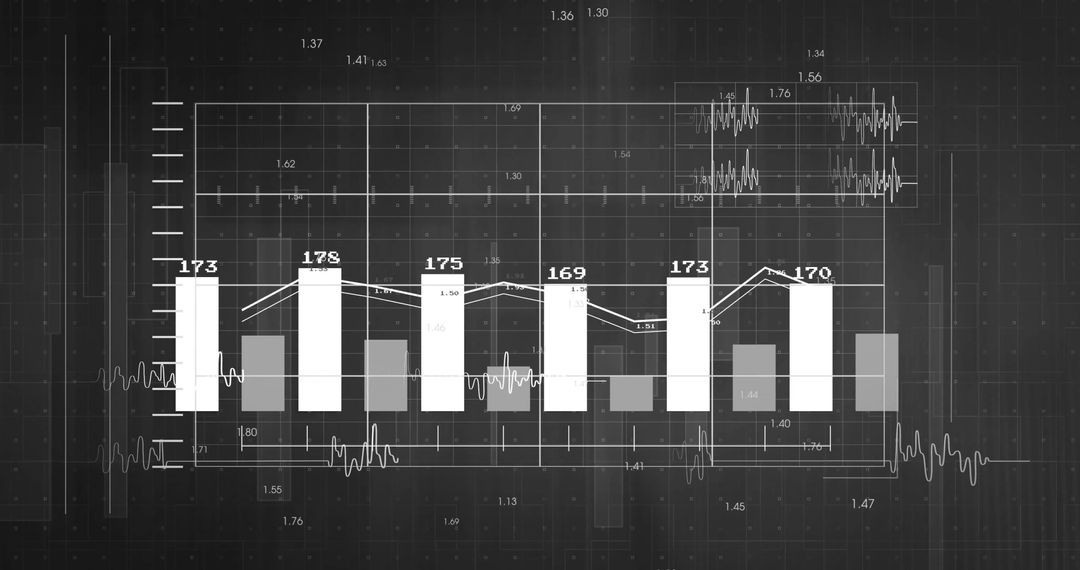
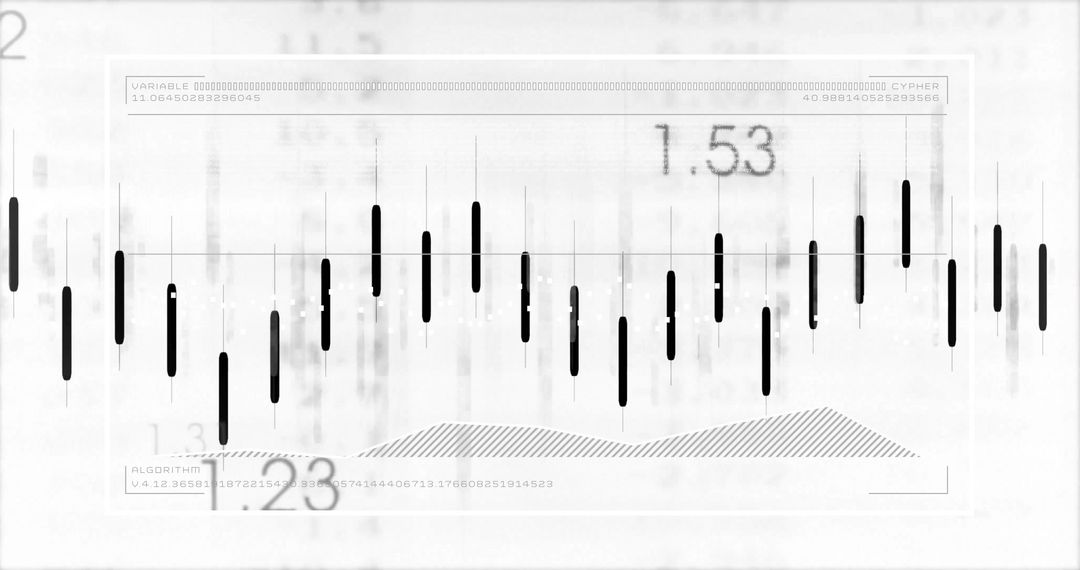
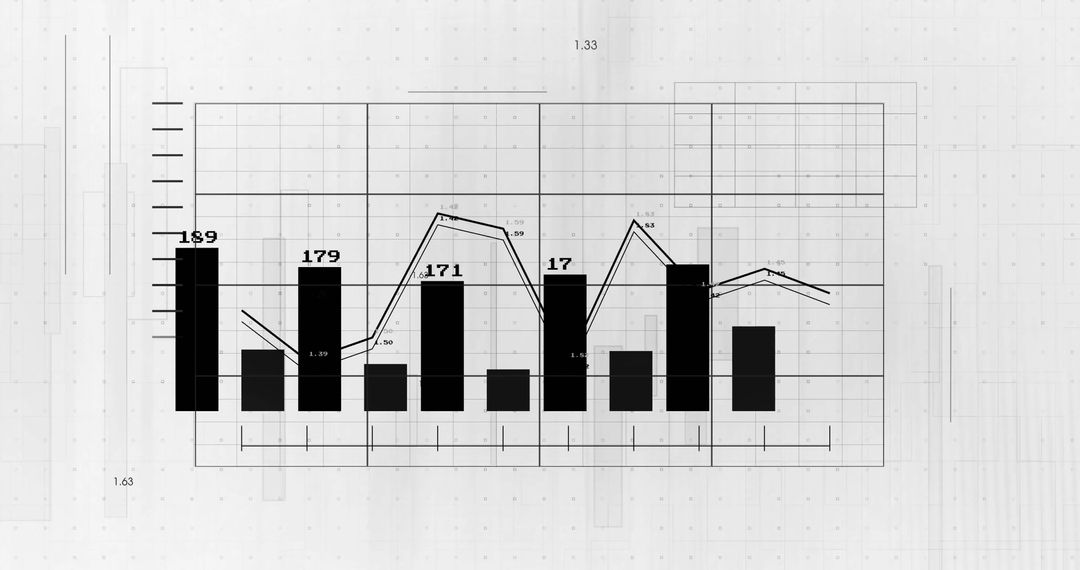
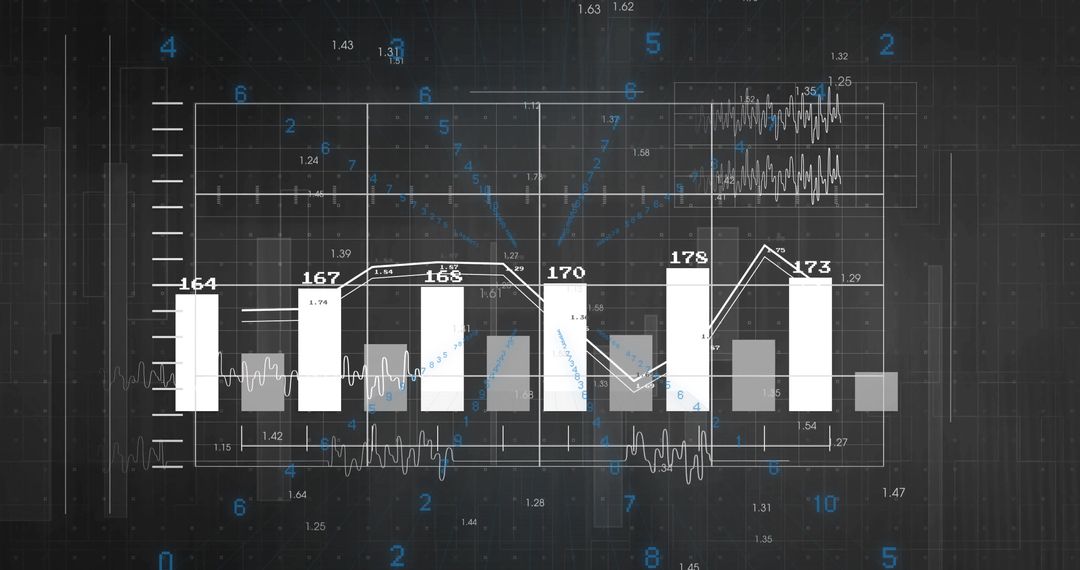
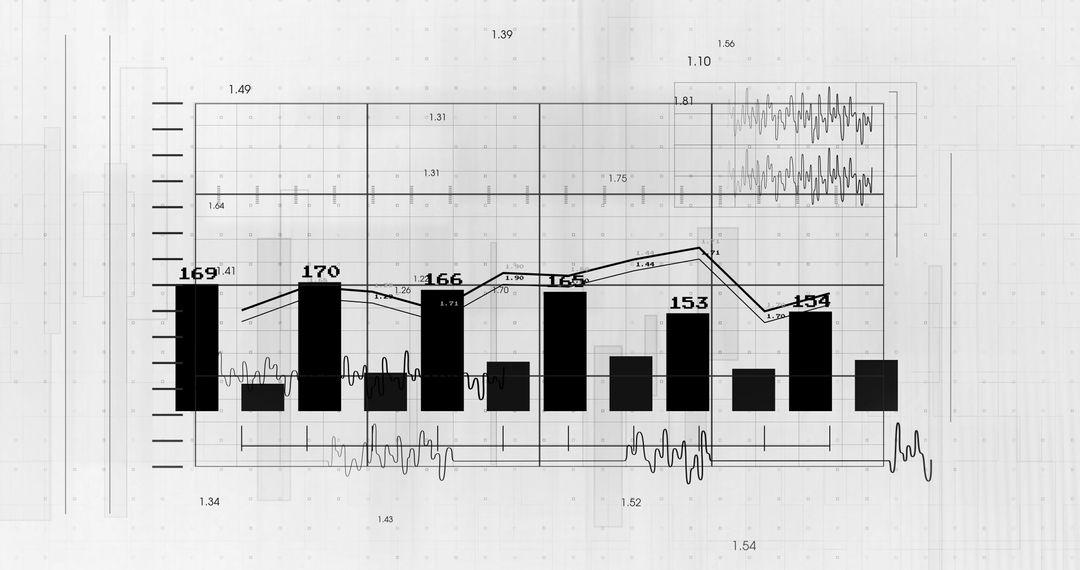
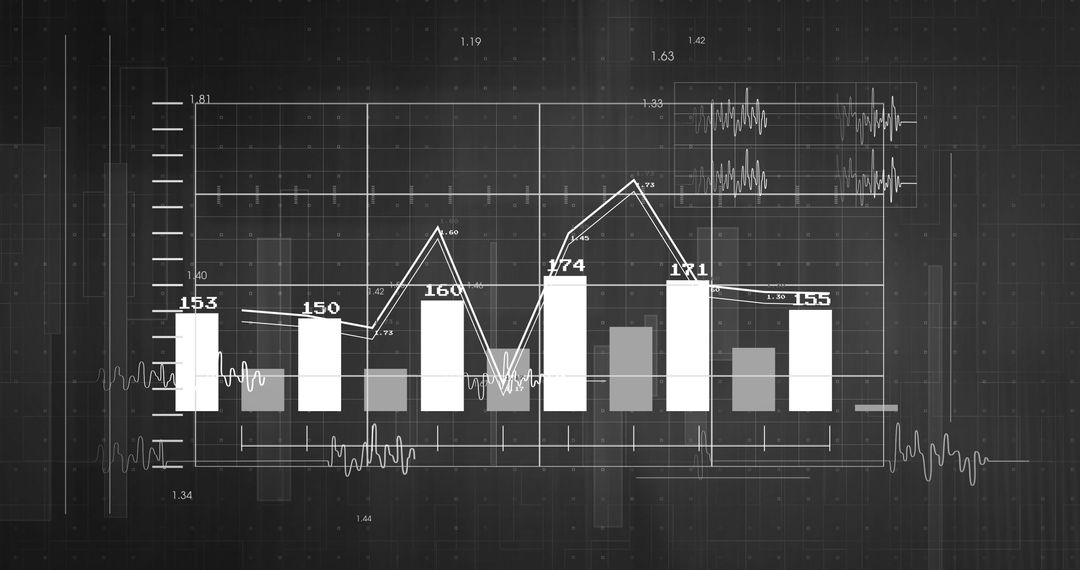
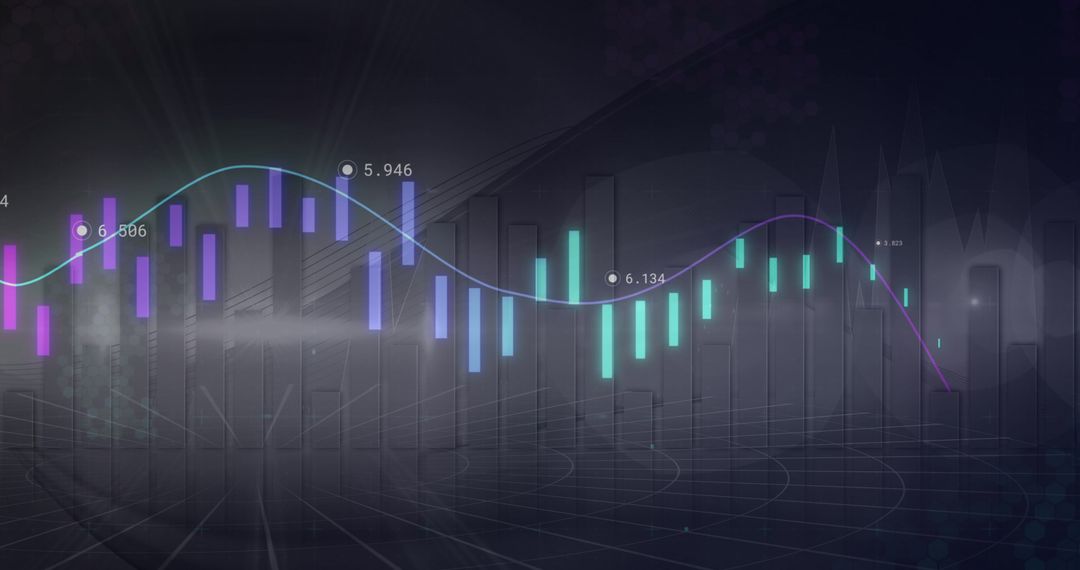
Abstract depiction of financial graph and data analysis using a black and white theme. Ideal for illustrating concepts related to global business, investment strategies, data-driven decision-making, economic forecasting, and technological advancements in finance. Suitable for use in presentations, reports, articles on finance and economy, and educational materials involving data interpretation and analysis.
Powered by  - Get 15% off with code: PIKWIZARD15


2
downloads
downloads
Tags:
More
Credit Photo
If you would like to credit the Photo, here are some ways you can do so
Text Link
photo Link
<span class="text-link">
<span>
<a target="_blank" href=https://pikwizard.com/photo/abstract-financial-graph-and-data-analysis-on-white-background/5a6afe57c9dcce76e1b43a09026921ab/>PikWizard</a>
</span>
</span>
<span class="image-link">
<span
style="margin: 0 0 20px 0; display: inline-block; vertical-align: middle; width: 100%;"
>
<a
target="_blank"
href="https://pikwizard.com/photo/abstract-financial-graph-and-data-analysis-on-white-background/5a6afe57c9dcce76e1b43a09026921ab/"
style="text-decoration: none; font-size: 10px; margin: 0;"
>
<img src="https://pikwizard.com/pw/medium/5a6afe57c9dcce76e1b43a09026921ab.jpg" style="margin: 0; width: 100%;" alt="" />
<p style="font-size: 12px; margin: 0;">PikWizard</p>
</a>
</span>
</span>
Free (free of charge)
Free for personal and commercial use.
Author: Creative Art
Similar Free Stock Images

Premium


Premium


Premium


Premium


Premium


Premium


Premium


Premium


Premium


Premium


Premium


Premium


Premium


Premium


Premium


Premium


Premium


Premium


Premium


Premium


Premium


Premium


Premium


Premium

