- Home >
- Stock Photos >
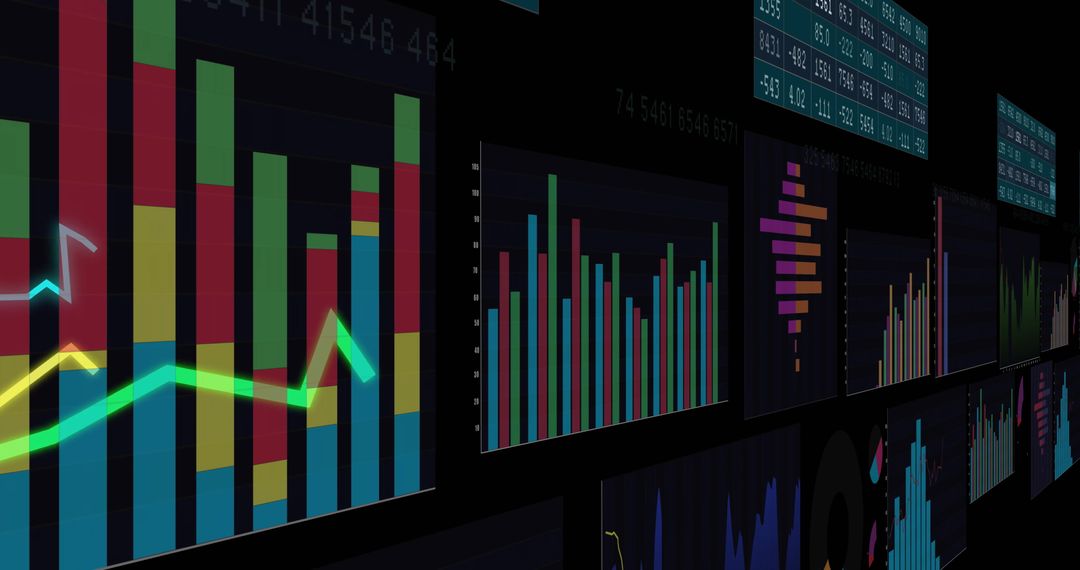
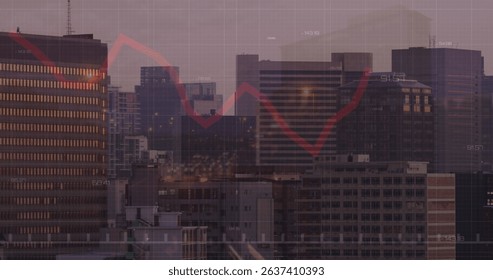
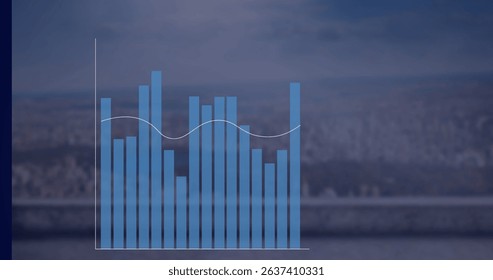
- Abstract Financial Graph Display on Dark Background
Abstract Financial Graph Display on Dark Background Image

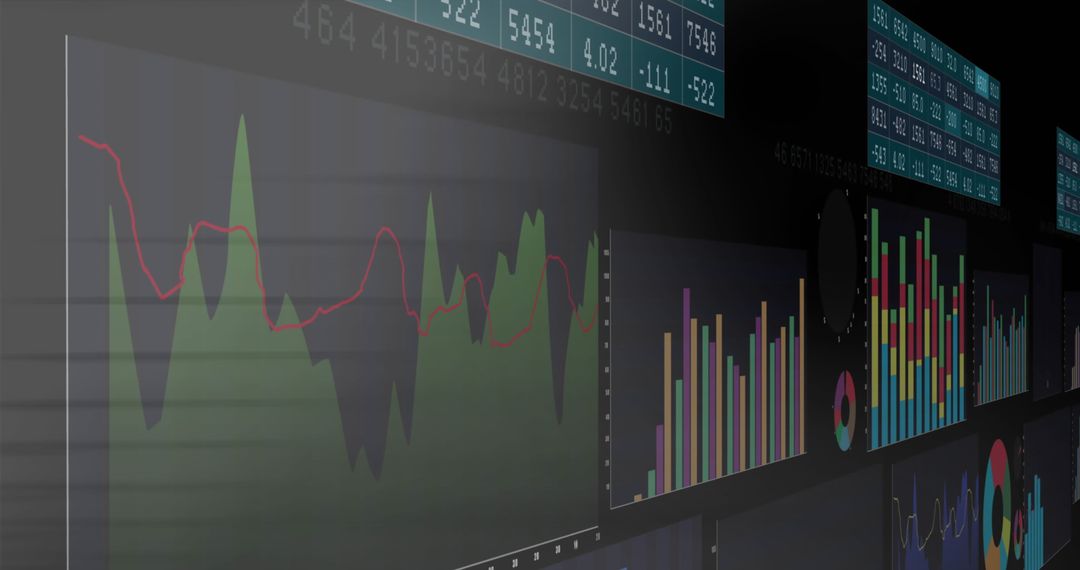
Abstract portrayal of financial graphs and charts overlay on dark background. Illustrates concepts of data processing and analysis across digital display screens, reflecting stock market performance and economic trends. Useful for illustrating technology in business analytics, financial publications, and economic data reviews. Ideal for business presentations and financial industry reports highlighting market activities and forecasts.
Powered by  - Get 15% off with code: PIKWIZARD15


2
downloads
downloads
Tags:
More
Credit Photo
If you would like to credit the Photo, here are some ways you can do so
Text Link
photo Link
<span class="text-link">
<span>
<a target="_blank" href=https://pikwizard.com/photo/abstract-financial-graph-display-on-dark-background/644f2a1a4c2769abf04e8d93d7797cc3/>PikWizard</a>
</span>
</span>
<span class="image-link">
<span
style="margin: 0 0 20px 0; display: inline-block; vertical-align: middle; width: 100%;"
>
<a
target="_blank"
href="https://pikwizard.com/photo/abstract-financial-graph-display-on-dark-background/644f2a1a4c2769abf04e8d93d7797cc3/"
style="text-decoration: none; font-size: 10px; margin: 0;"
>
<img src="https://pikwizard.com/pw/medium/644f2a1a4c2769abf04e8d93d7797cc3.jpg" style="margin: 0; width: 100%;" alt="" />
<p style="font-size: 12px; margin: 0;">PikWizard</p>
</a>
</span>
</span>
Free (free of charge)
Free for personal and commercial use.
Author: Awesome Content
Similar Free Stock Images

Premium


Premium


Premium


Premium


Premium


Premium


Premium


Premium


Premium


Premium


Premium


Premium


Premium


Premium


Premium


Premium


Premium


Premium


Premium


Premium


Premium


Premium


Premium


Premium