- Home >
- Stock Photos >
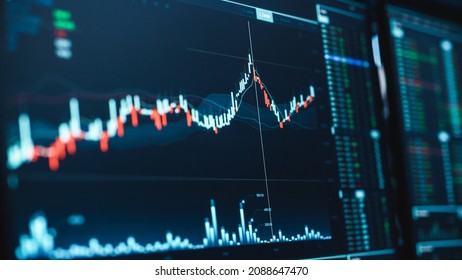
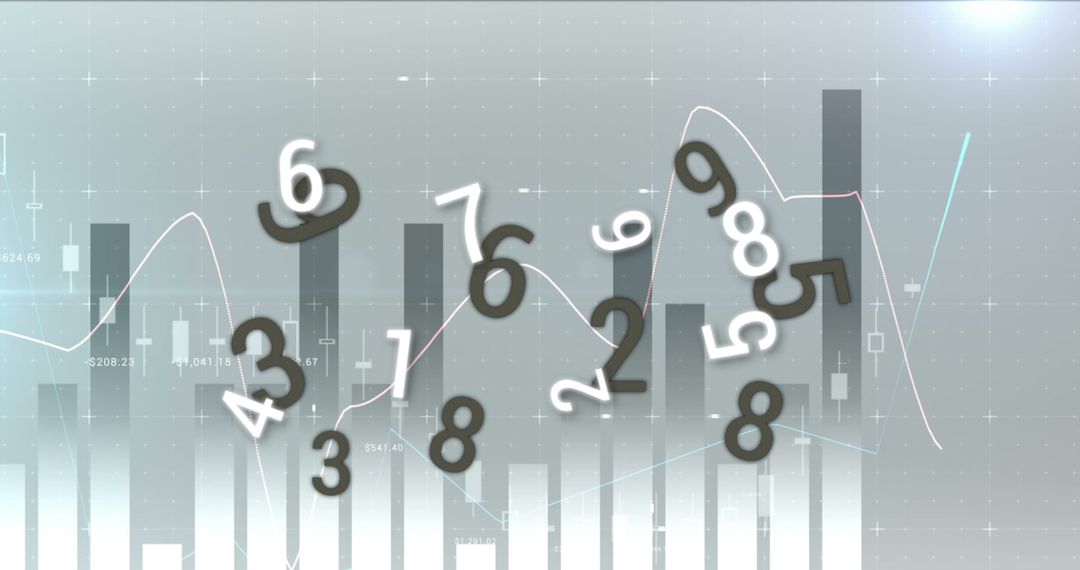
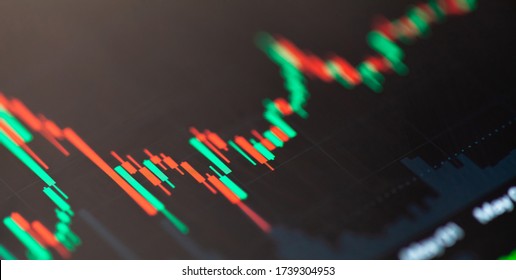
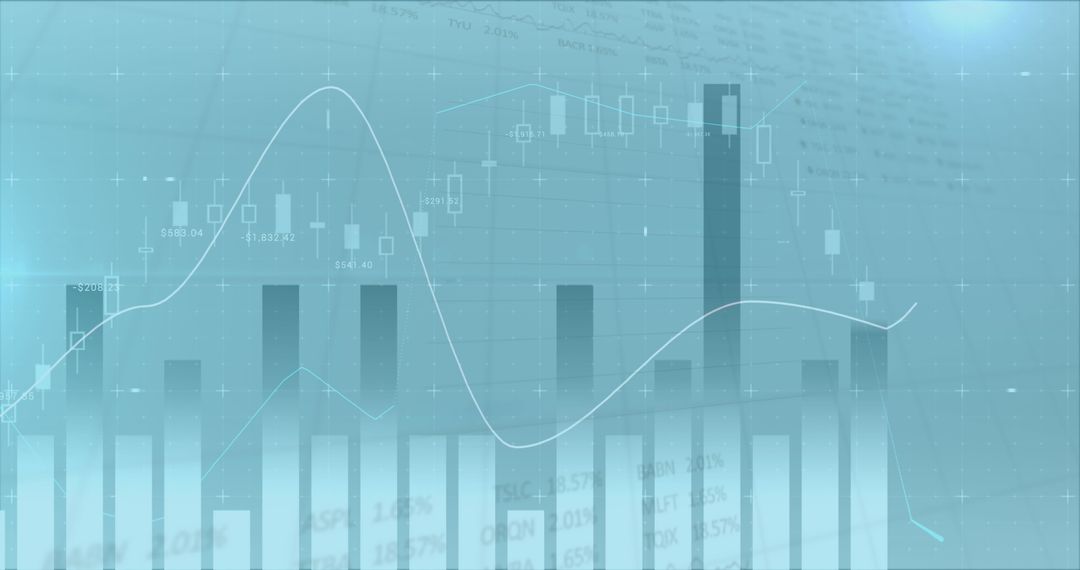
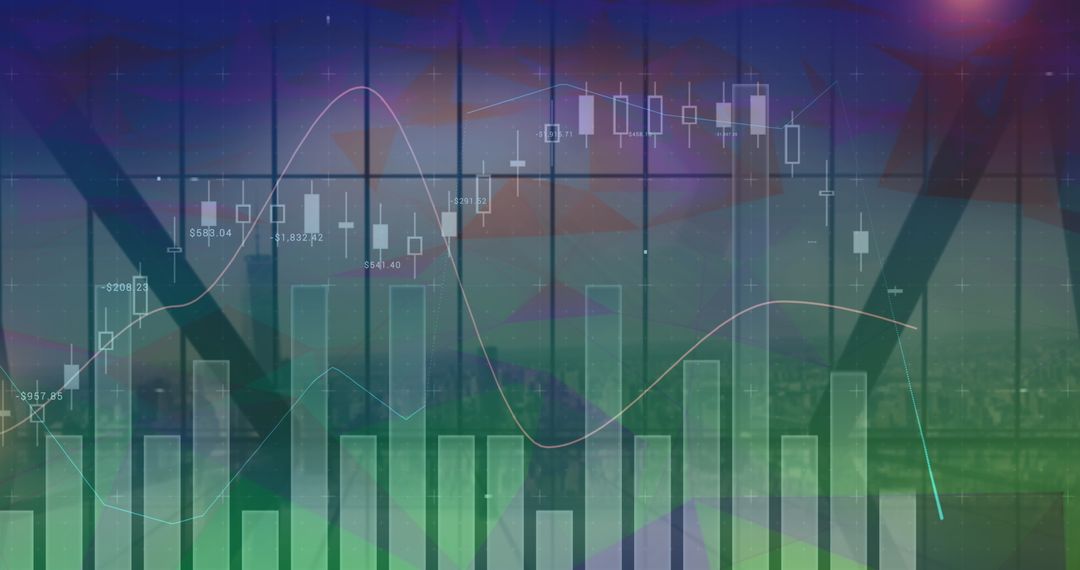
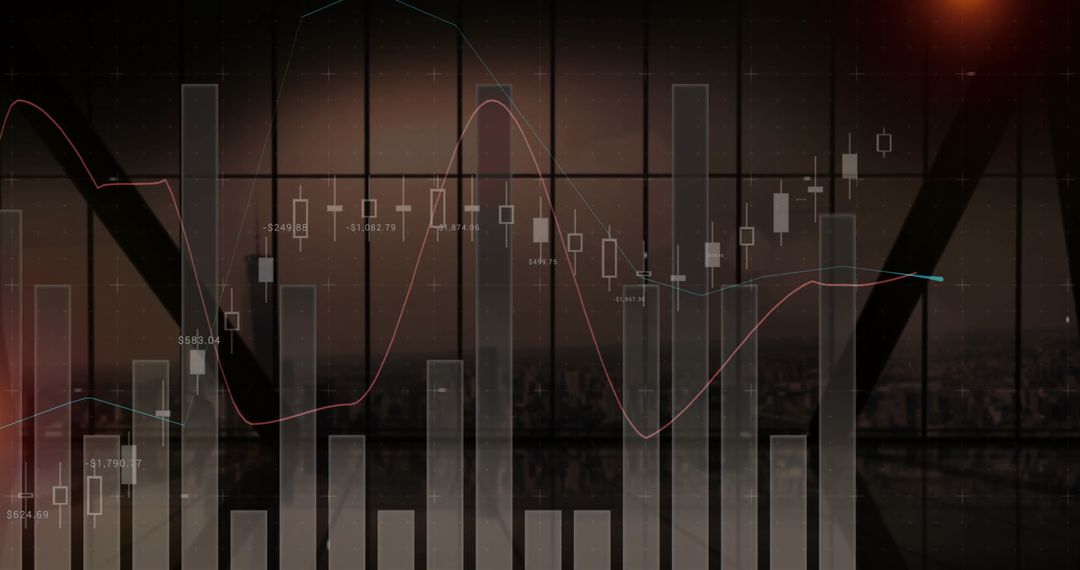
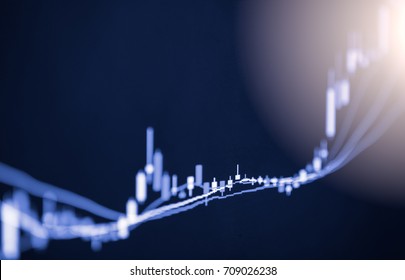
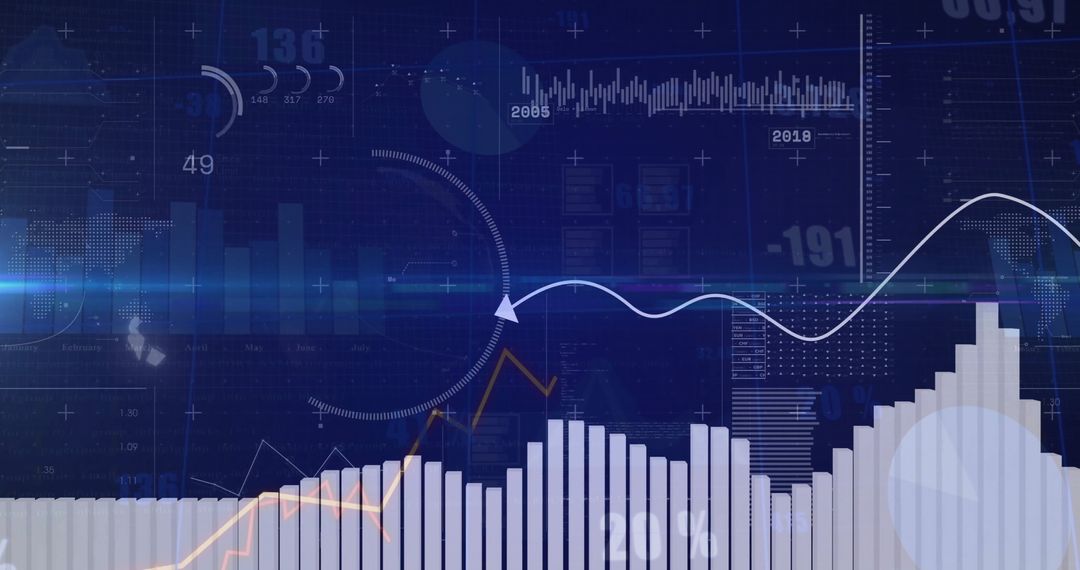
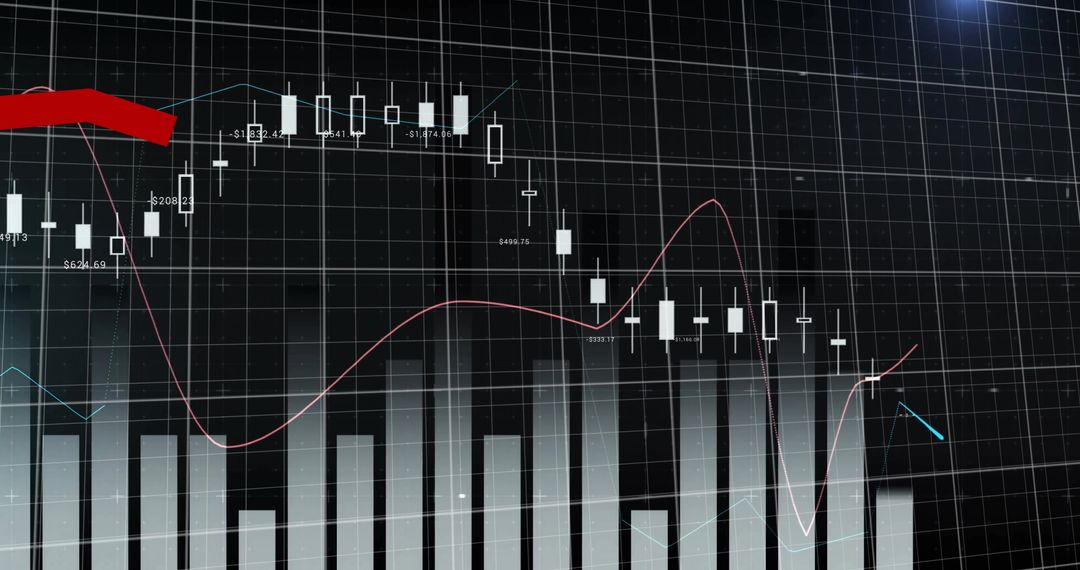
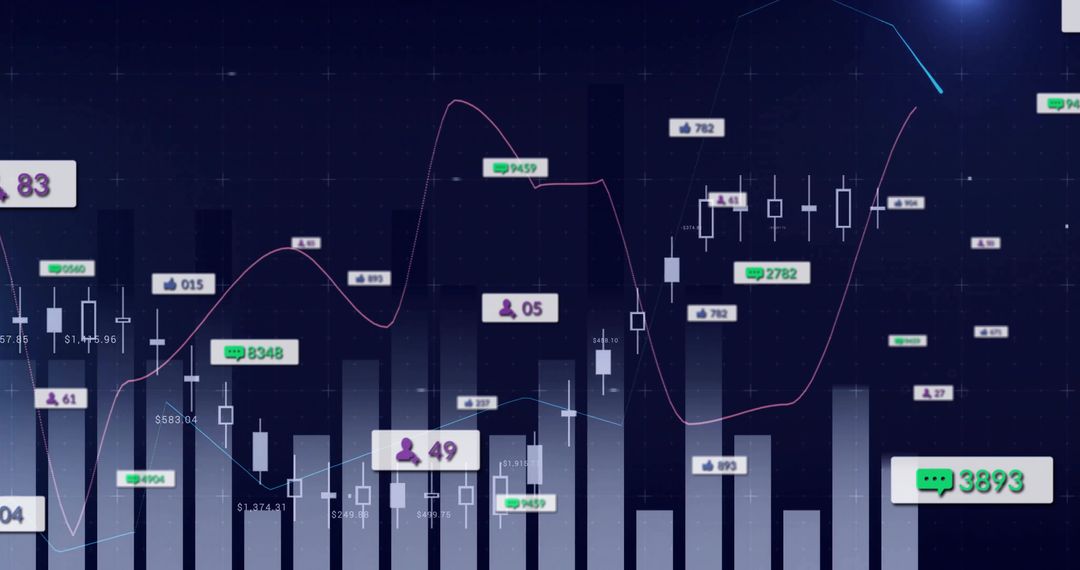
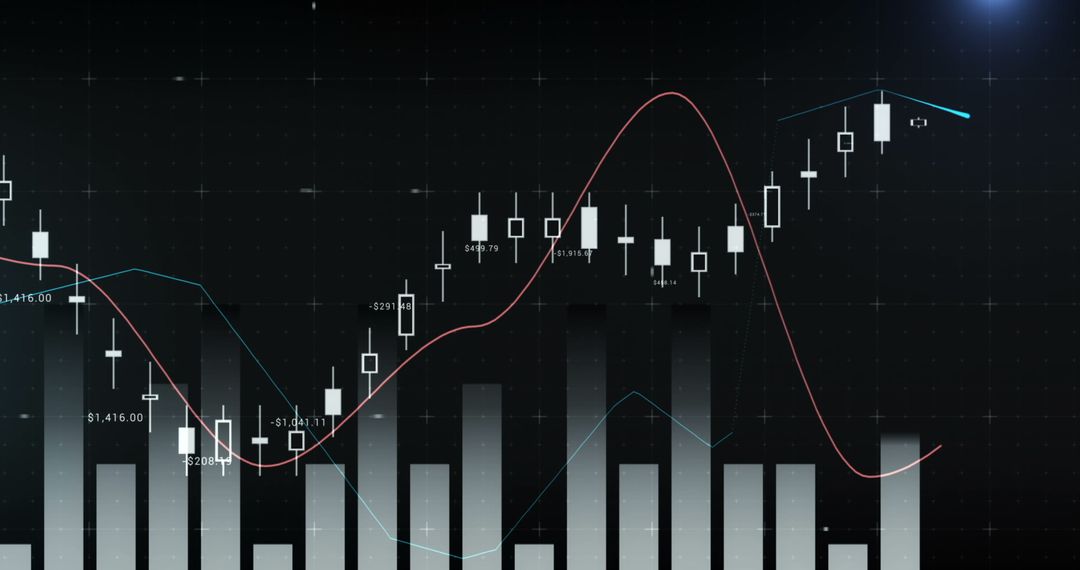
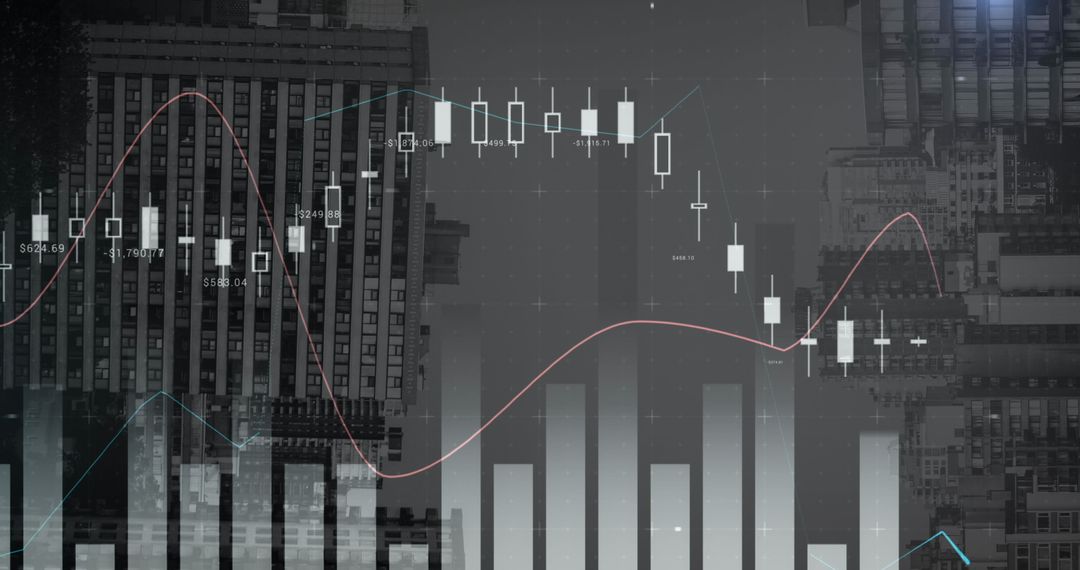
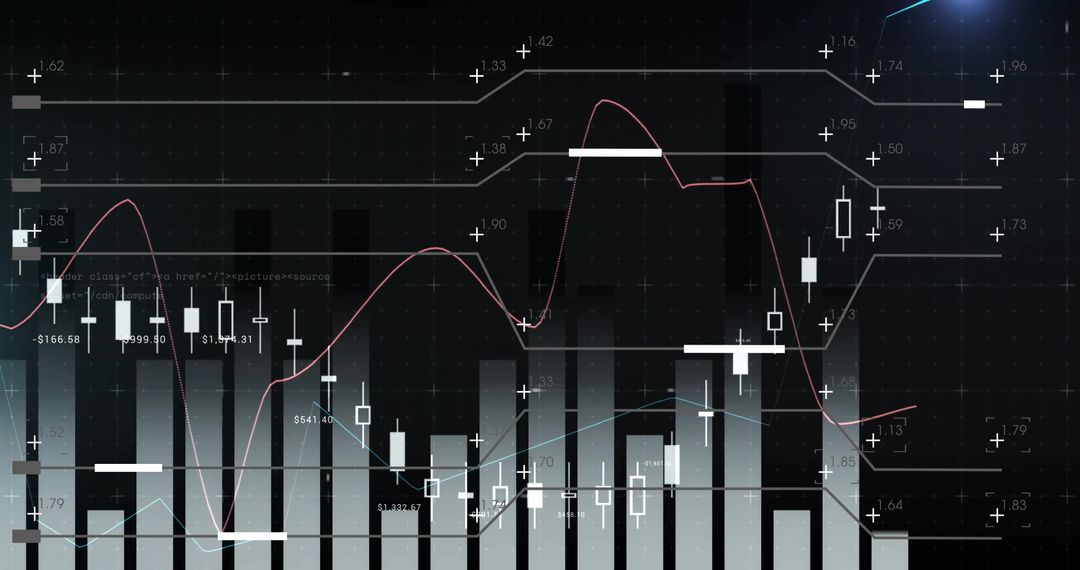
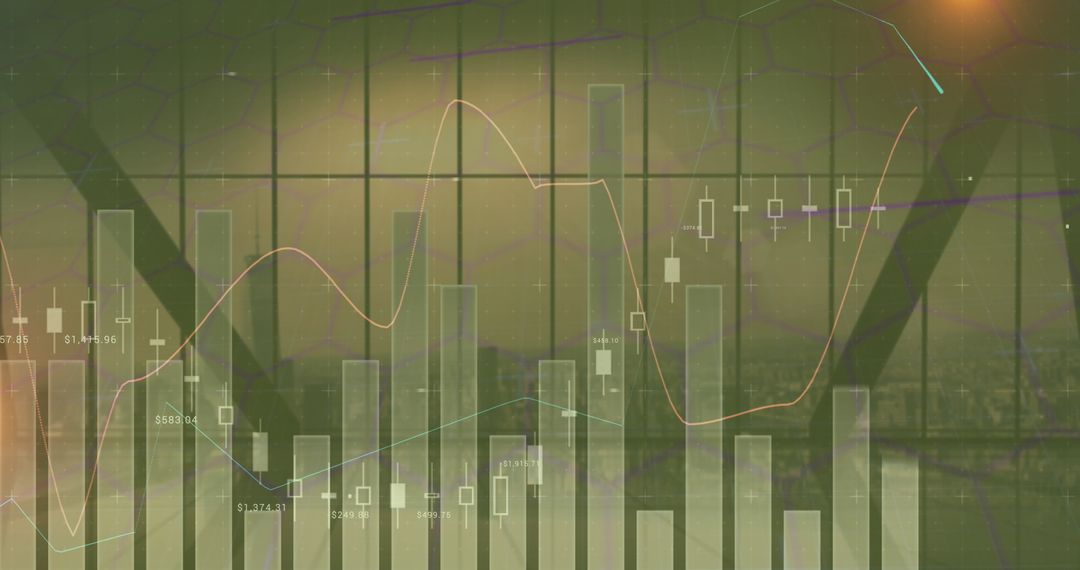
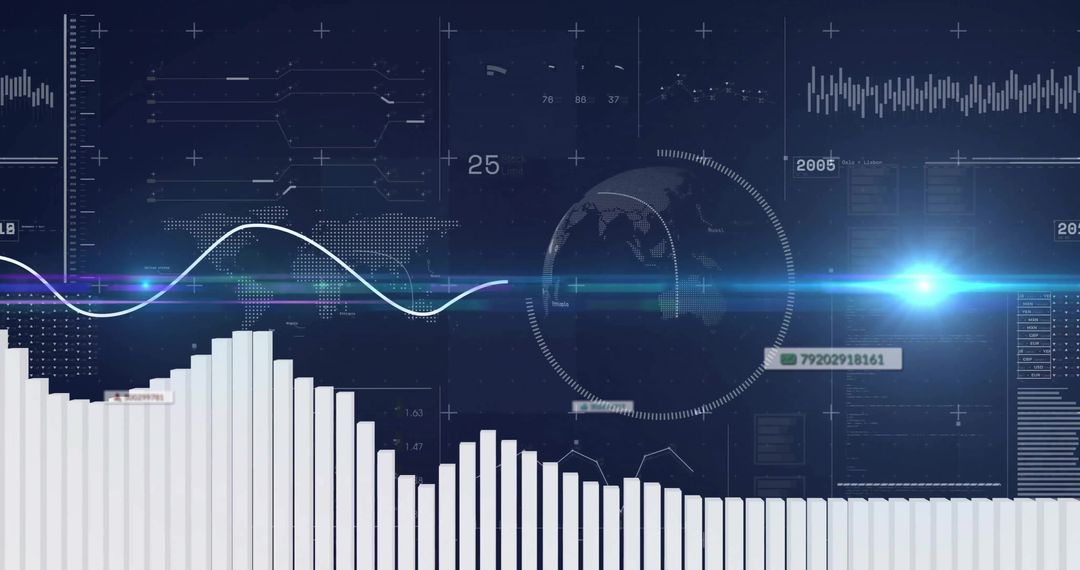
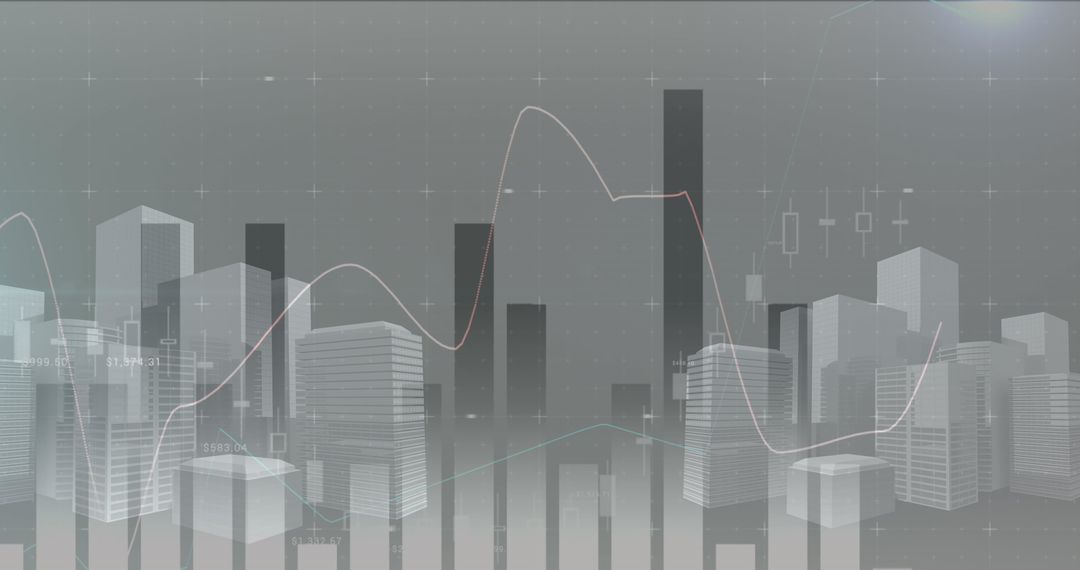
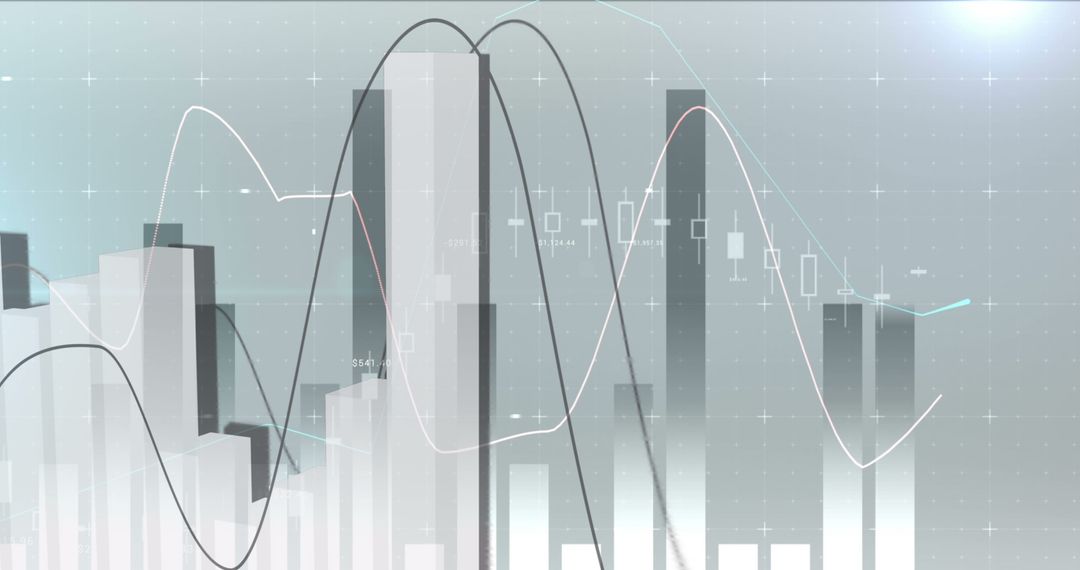
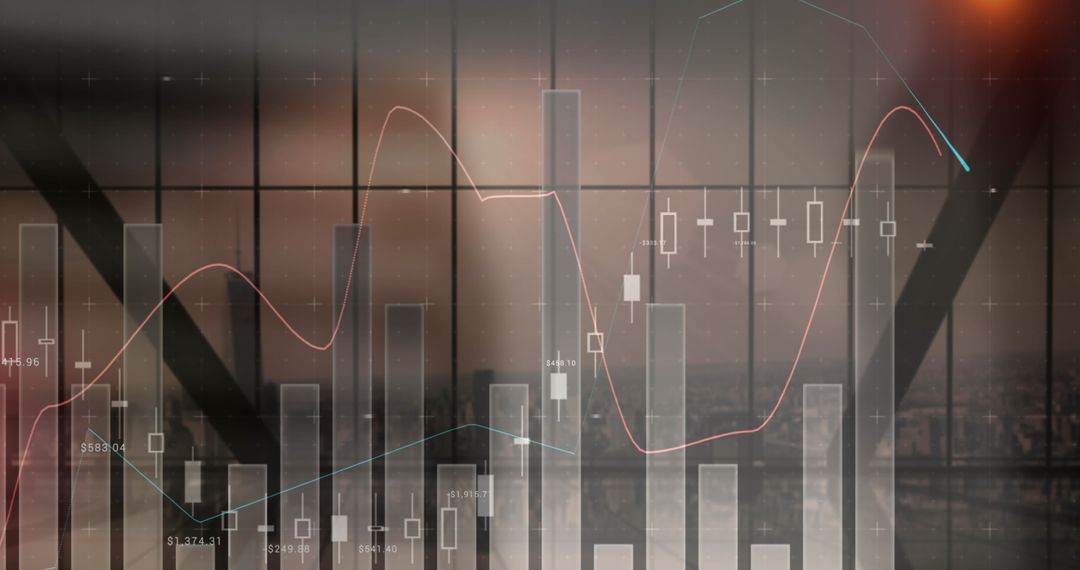
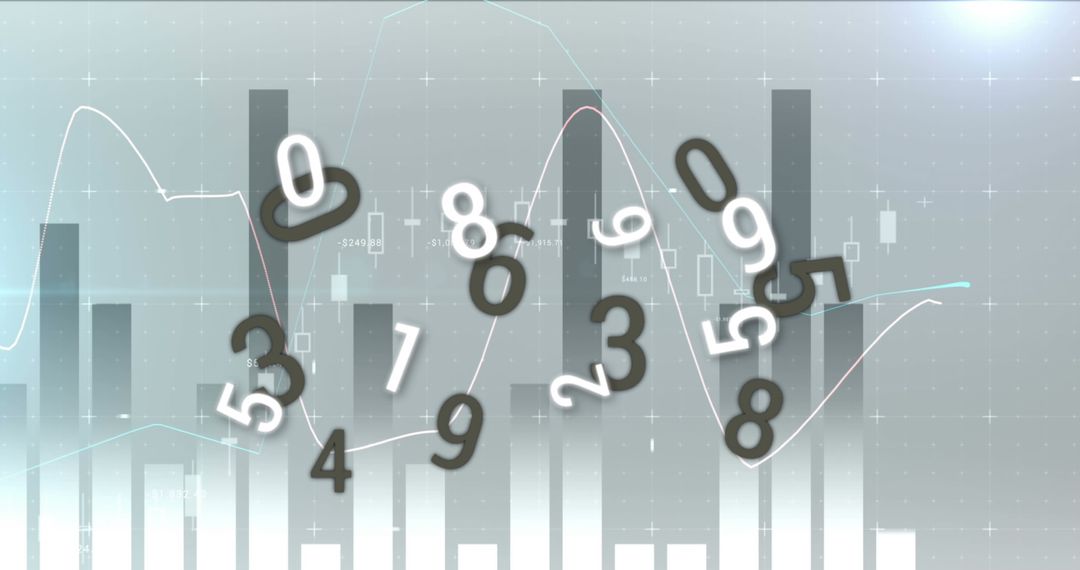
- Abstract Financial Market Analysis with Candlestick and Bar Charts
Abstract Financial Market Analysis with Candlestick and Bar Charts Image

Candlestick and bar charts combine to depict financial market trends, presented in a sleek, abstract design. The convergence of visual elements showcases the dynamic nature of stock performance, suited for use in presentations on investment strategies, economic analytic reports, or visually engaging for financial-related websites or blogs to illustrate market trends and data-driven content.
Powered by  - Get 15% off with code: PIKWIZARD15


4
downloads
downloads
Tags:
More
Credit Photo
If you would like to credit the Photo, here are some ways you can do so
Text Link
photo Link
<span class="text-link">
<span>
<a target="_blank" href=https://pikwizard.com/photo/abstract-financial-market-analysis-with-candlestick-and-bar-charts/0ab6a879365f18f0f8f634b87a607812/>PikWizard</a>
</span>
</span>
<span class="image-link">
<span
style="margin: 0 0 20px 0; display: inline-block; vertical-align: middle; width: 100%;"
>
<a
target="_blank"
href="https://pikwizard.com/photo/abstract-financial-market-analysis-with-candlestick-and-bar-charts/0ab6a879365f18f0f8f634b87a607812/"
style="text-decoration: none; font-size: 10px; margin: 0;"
>
<img src="https://pikwizard.com/pw/medium/0ab6a879365f18f0f8f634b87a607812.jpg" style="margin: 0; width: 100%;" alt="" />
<p style="font-size: 12px; margin: 0;">PikWizard</p>
</a>
</span>
</span>
Free (free of charge)
Free for personal and commercial use.
Author: People Creations
Similar Free Stock Images
Premium


Premium


Premium


Premium


Premium


Premium


Premium


Premium


Premium


Premium


Premium


Premium


Premium


Premium


Premium


Premium


Premium


Premium


Premium


Premium


Premium


Premium


Premium


Premium