- Home >
- Stock Photos >
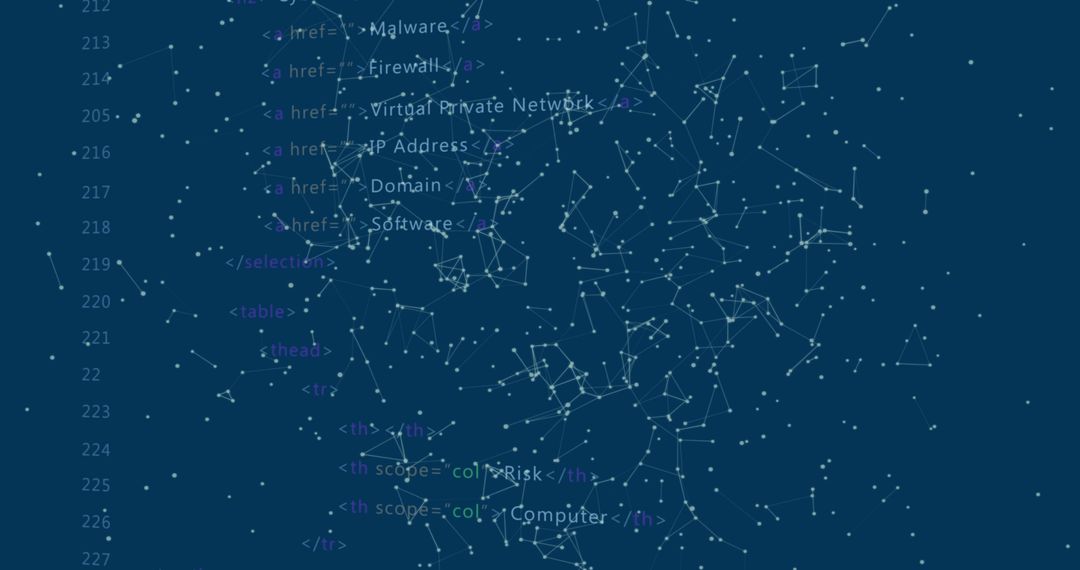
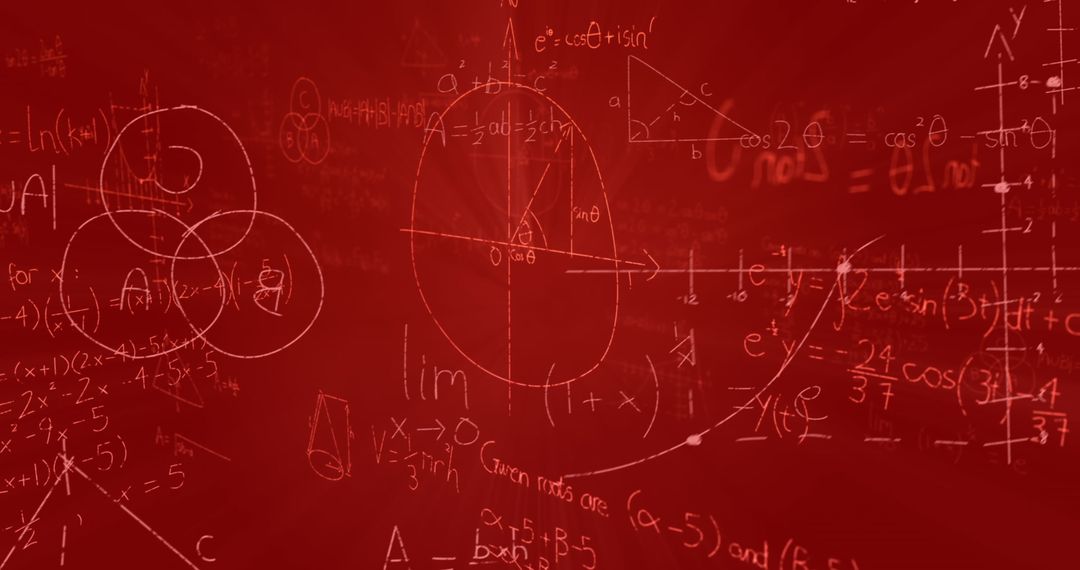
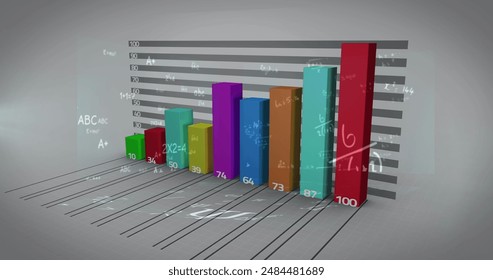
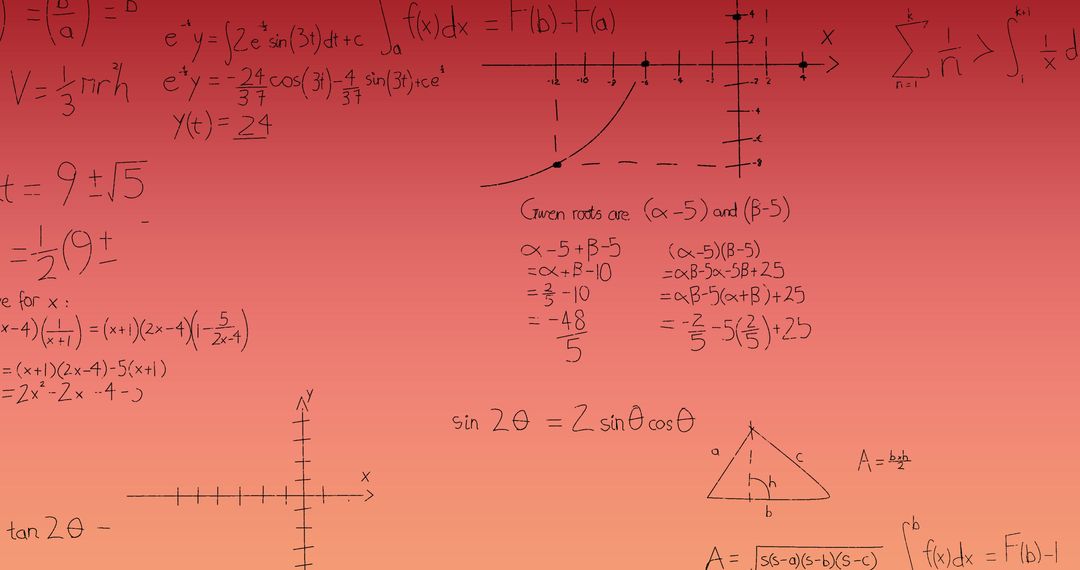
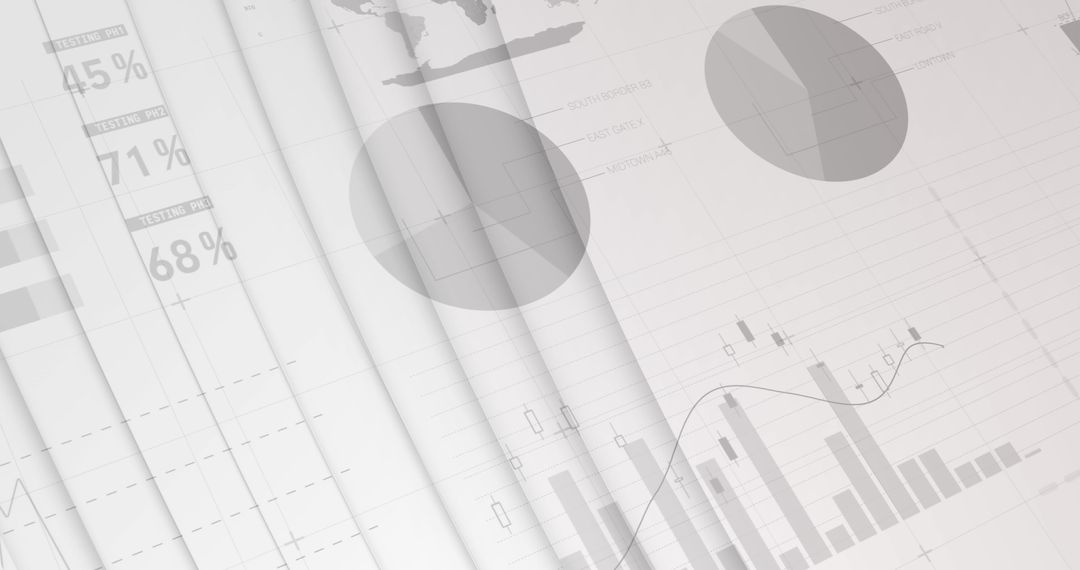
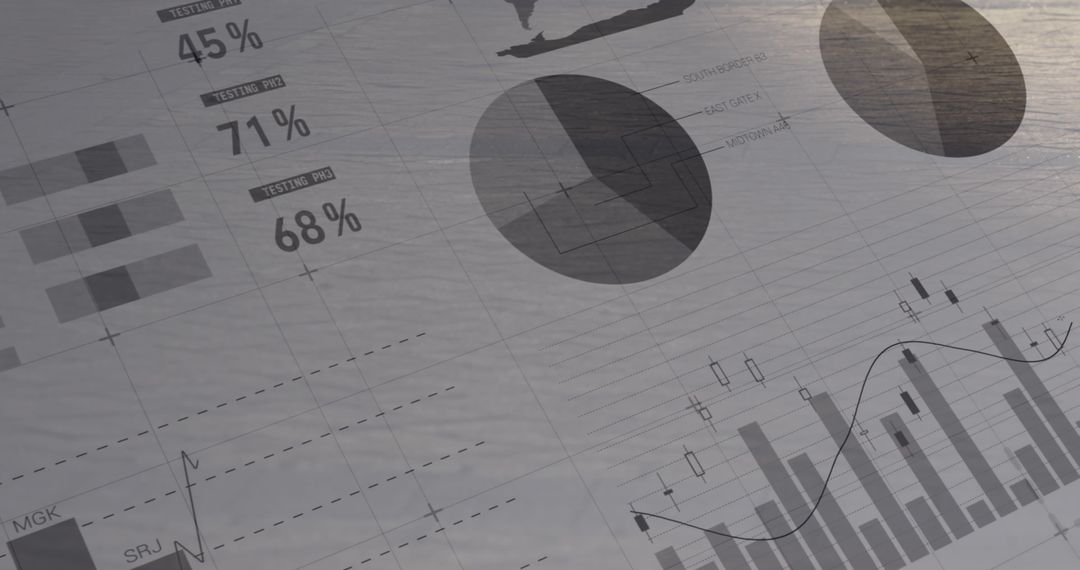
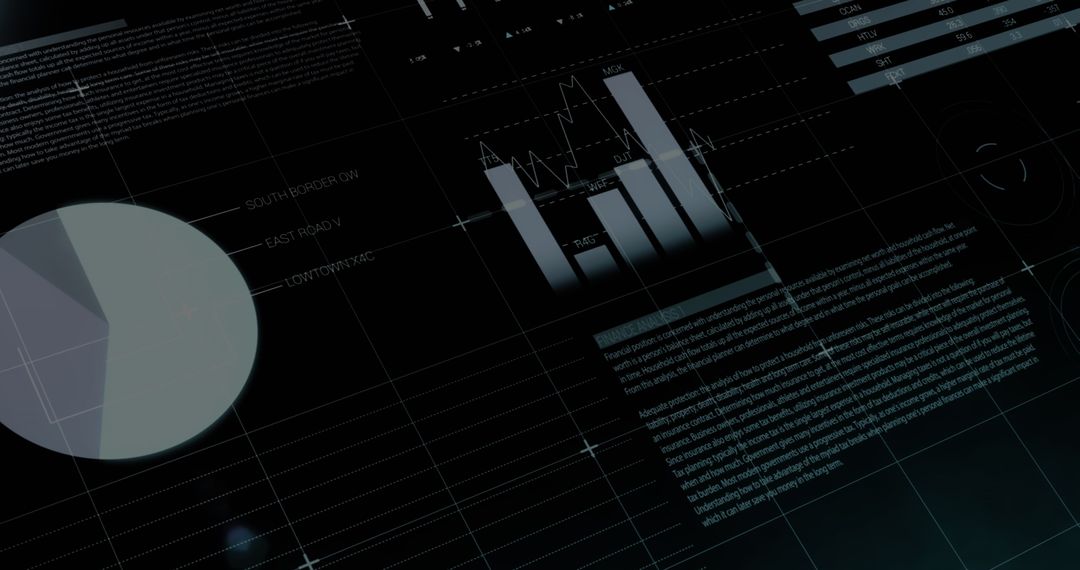
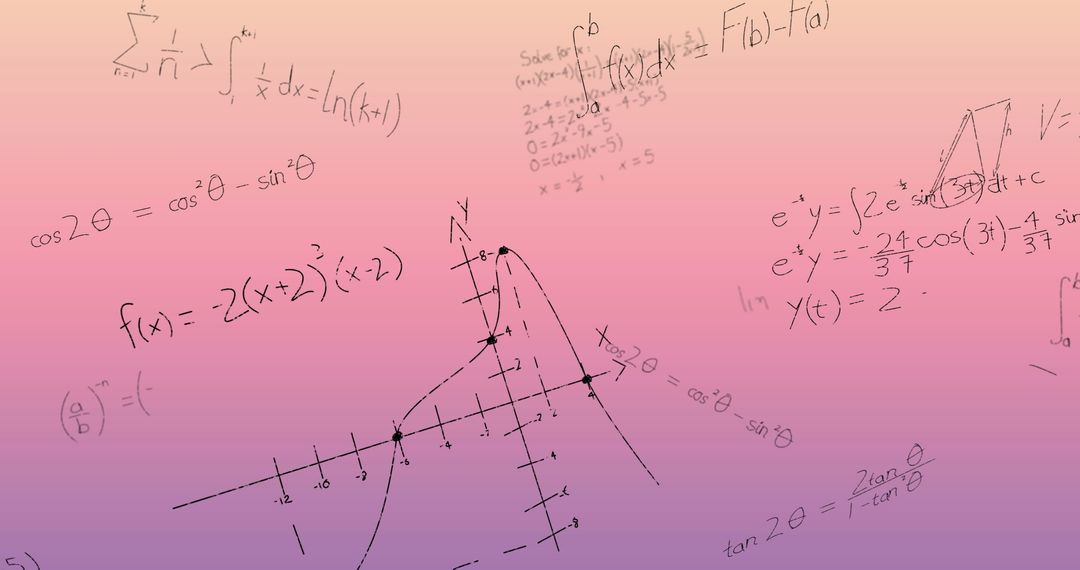
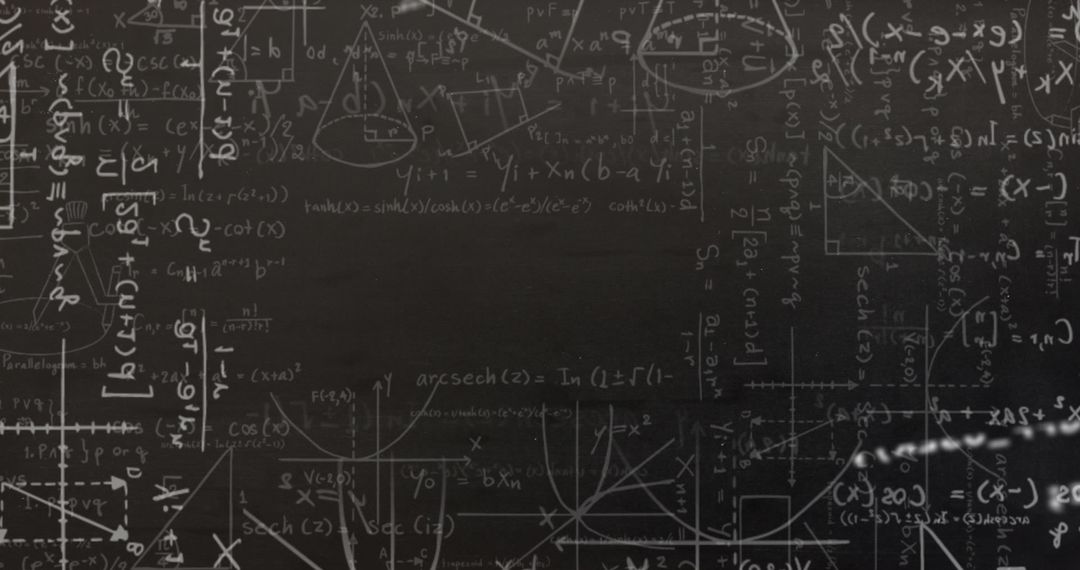
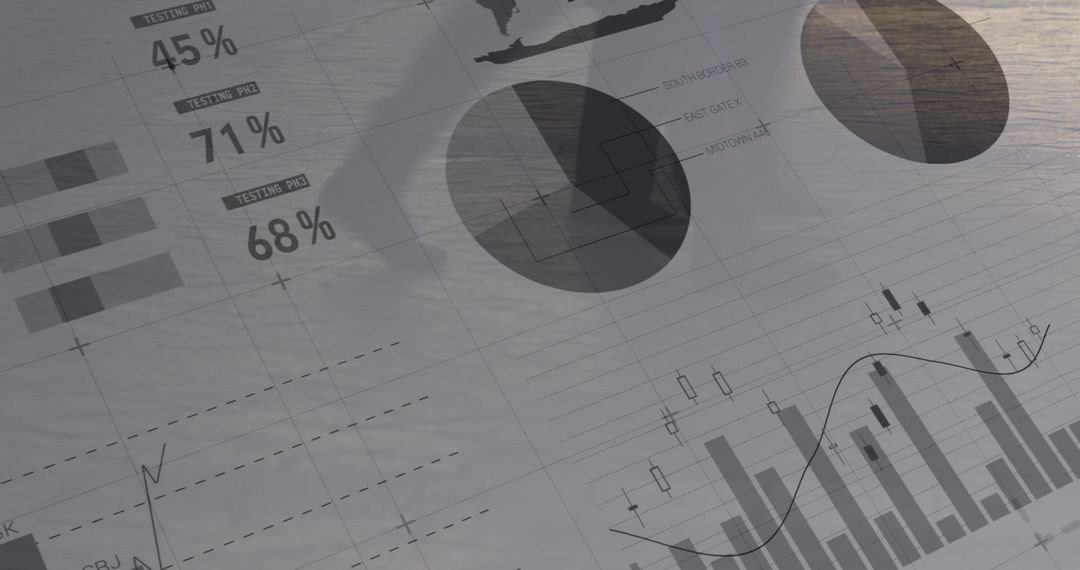
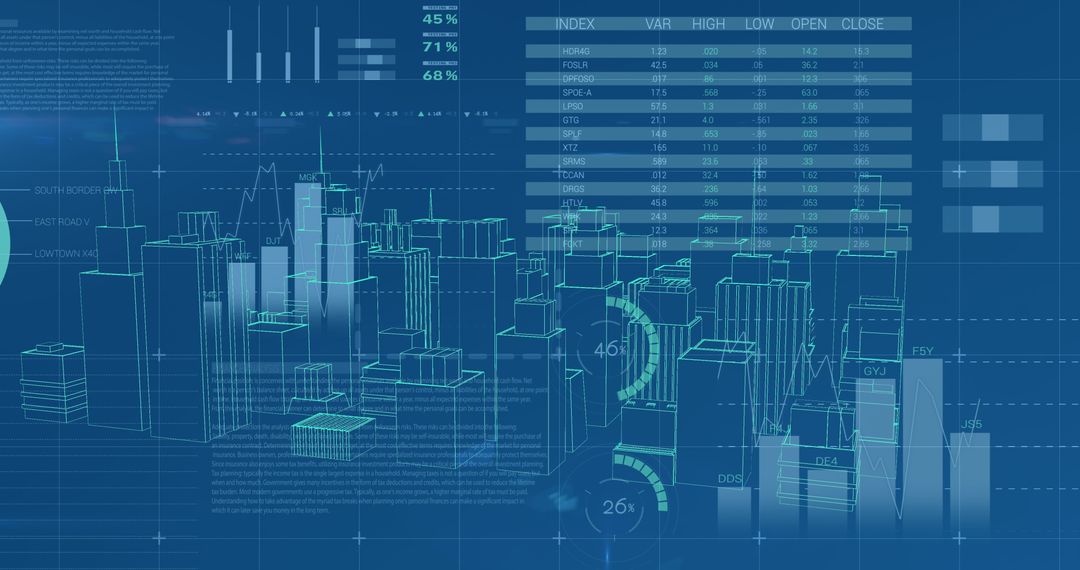
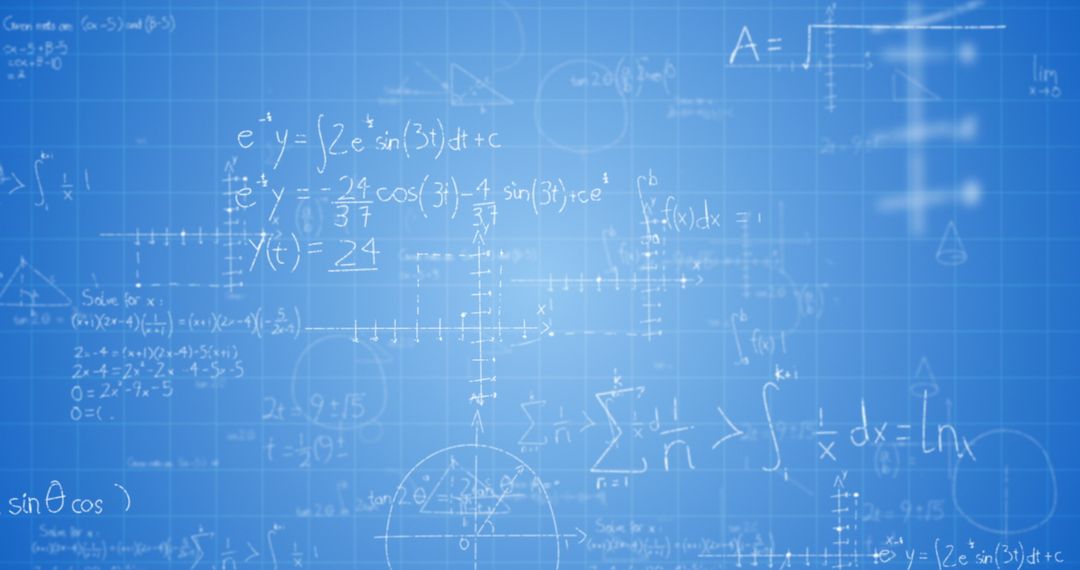
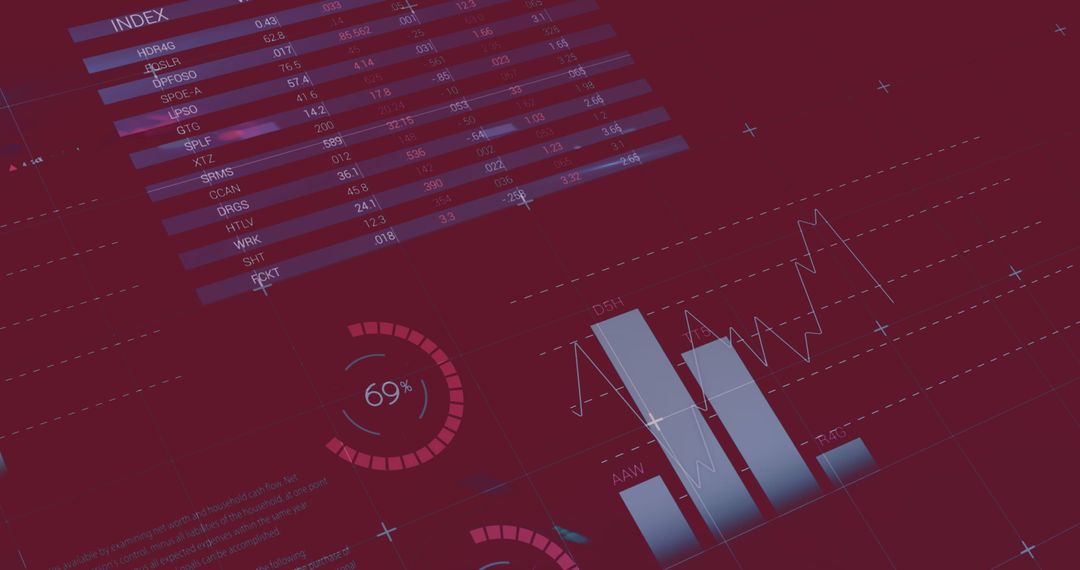
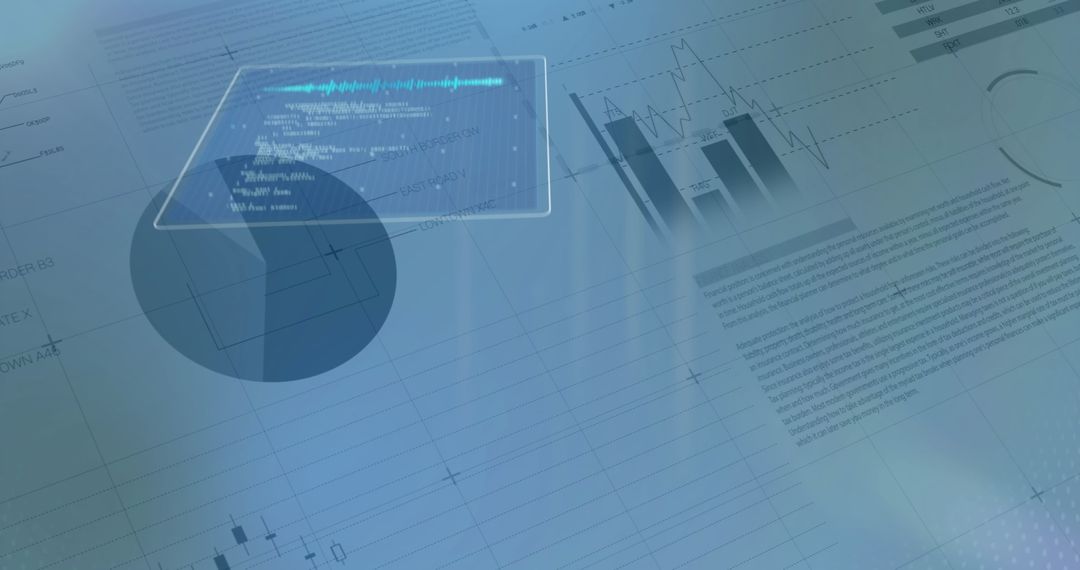
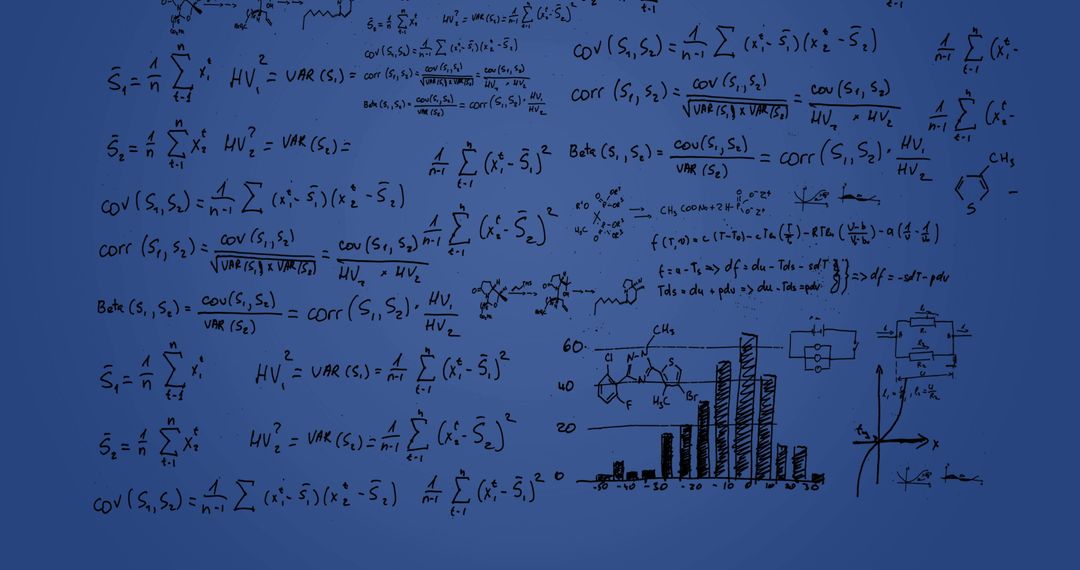
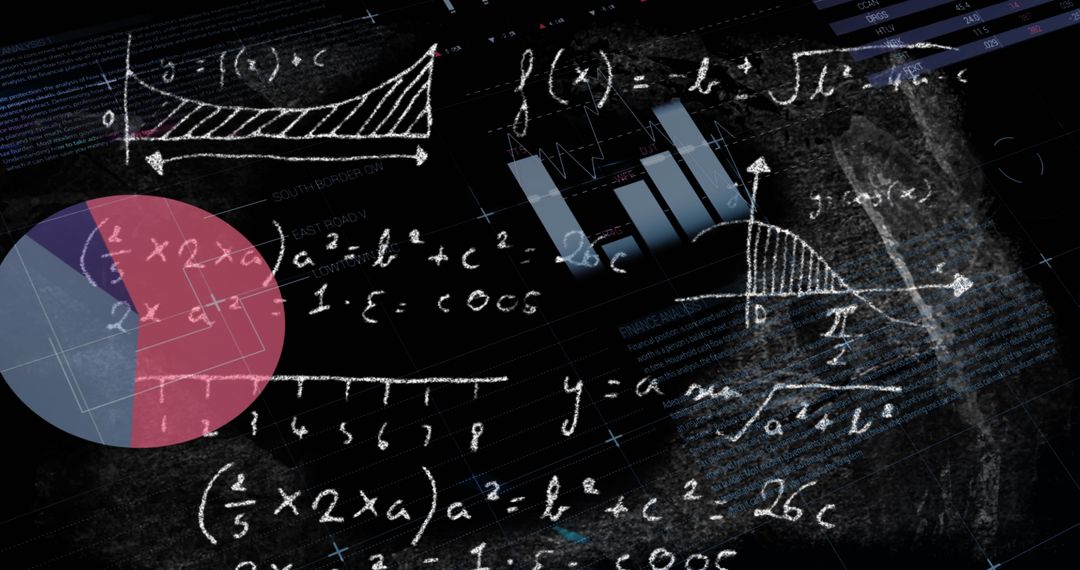
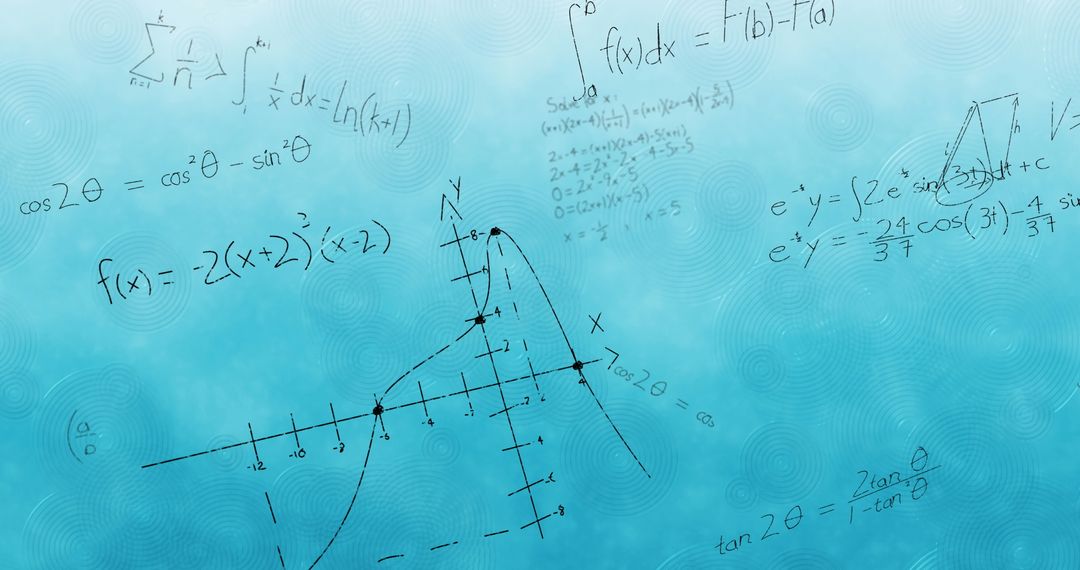
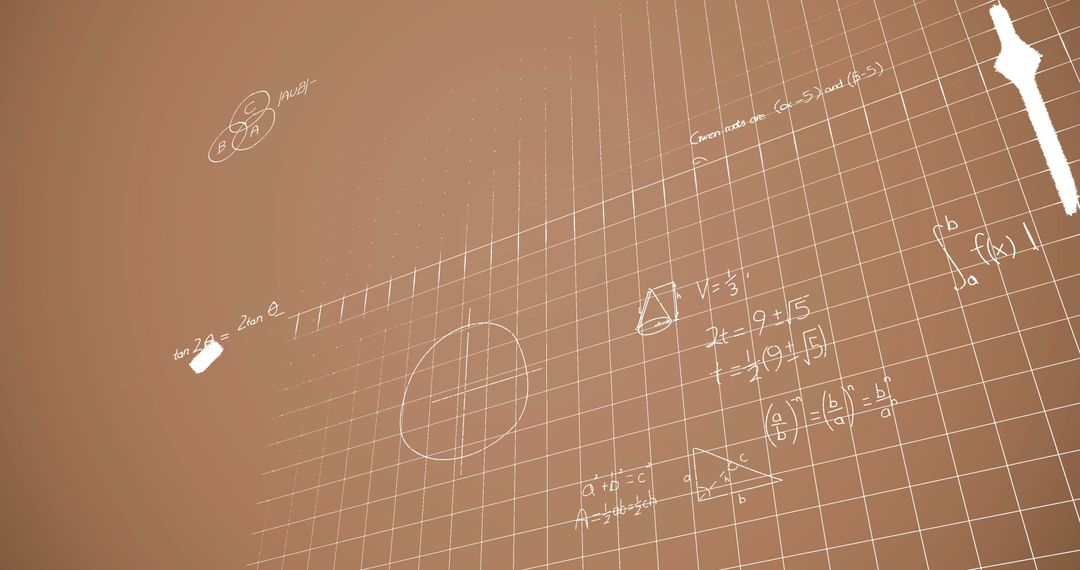
- Abstract Mathematics and Statistics Background Overlay
Abstract Mathematics and Statistics Background Overlay Image

Digital blend showing mathematical formulas overlaying with statistical graphs and data. Ideal for tech, education, or scientific article covers illustrating analytics or data-driven approaches. Could be used in online content for academics, engineers, or data scientists.
Powered by  - Get 15% off with code: PIKWIZARD15


2
downloads
downloads
Tags:
More
Credit Photo
If you would like to credit the Photo, here are some ways you can do so
Text Link
photo Link
<span class="text-link">
<span>
<a target="_blank" href=https://pikwizard.com/photo/abstract-mathematics-and-statistics-background-overlay/0d058e859dd5032441fad46076254d6a/>PikWizard</a>
</span>
</span>
<span class="image-link">
<span
style="margin: 0 0 20px 0; display: inline-block; vertical-align: middle; width: 100%;"
>
<a
target="_blank"
href="https://pikwizard.com/photo/abstract-mathematics-and-statistics-background-overlay/0d058e859dd5032441fad46076254d6a/"
style="text-decoration: none; font-size: 10px; margin: 0;"
>
<img src="https://pikwizard.com/pw/medium/0d058e859dd5032441fad46076254d6a.jpg" style="margin: 0; width: 100%;" alt="" />
<p style="font-size: 12px; margin: 0;">PikWizard</p>
</a>
</span>
</span>
Free (free of charge)
Free for personal and commercial use.
Author: Creative Art
Similar Free Stock Images
Premium


Premium


Premium


Premium


Premium


Premium


Premium


Premium


Premium


Premium


Premium


Premium


Premium


Premium


Premium


Premium


Premium


Premium


Premium


Premium


Premium


Premium


Premium


Premium