- Home >
- Stock Photos >
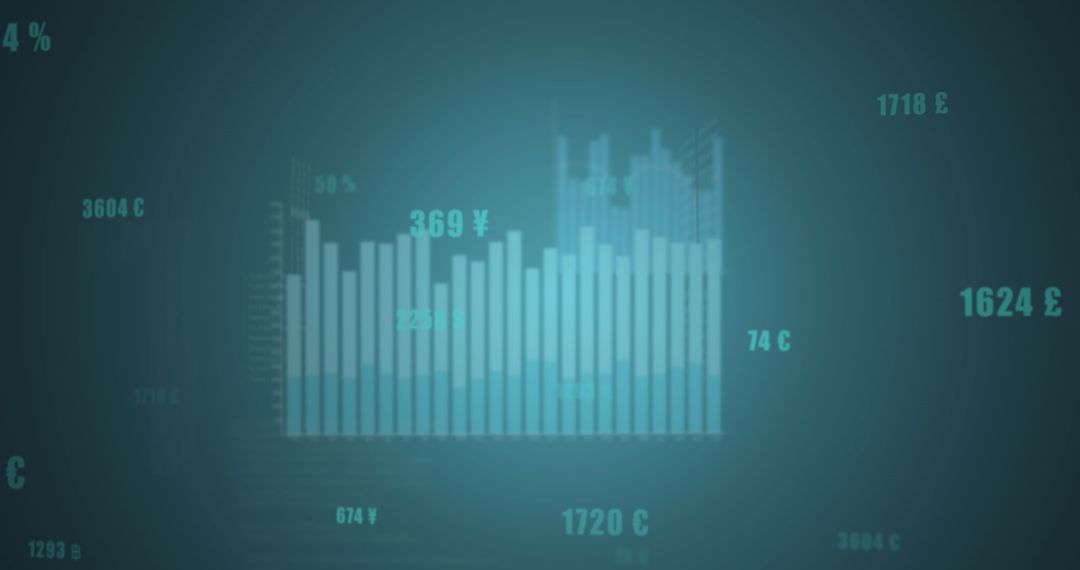
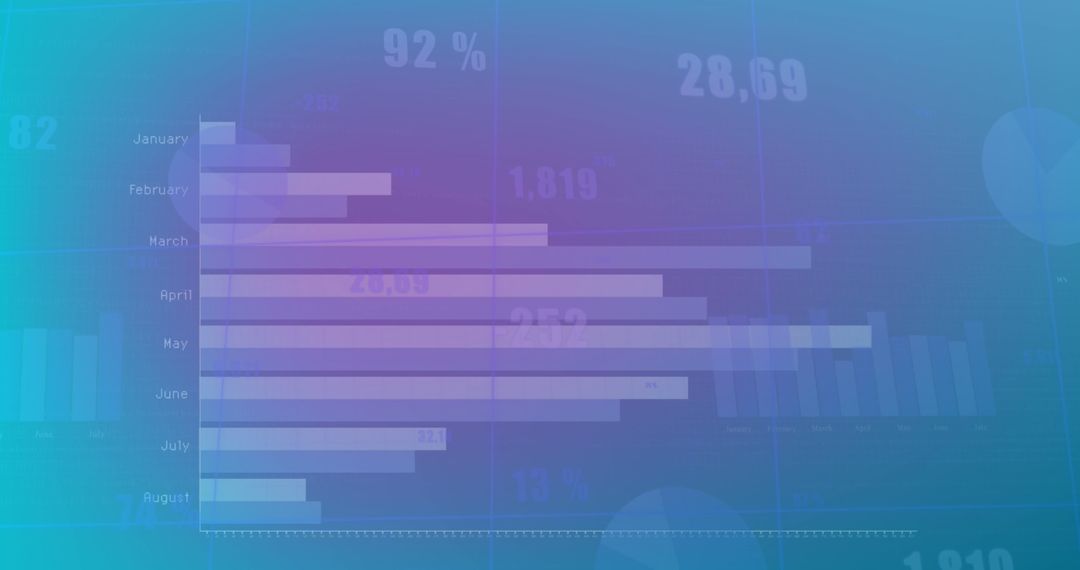
- Abstract Stock Market and Data Analysis in Purple Hue
Abstract Stock Market and Data Analysis in Purple Hue Image

Abstract depiction of stock market graphs and statistical data across a gradient purple background. This creates a futuristic and analytical feel, perfect for use in financial technology articles, investment reports, or business presentations. Encourages themes of growth, insights, and modern data analysis techniques.
Powered by  - Get 15% off with code: PIKWIZARD15


2
downloads
downloads
Tags:
More
Credit Photo
If you would like to credit the Photo, here are some ways you can do so
Text Link
photo Link
<span class="text-link">
<span>
<a target="_blank" href=https://pikwizard.com/photo/abstract-stock-market-and-data-analysis-in-purple-hue/6d3992c686967b2e62c7f853843403e7/>PikWizard</a>
</span>
</span>
<span class="image-link">
<span
style="margin: 0 0 20px 0; display: inline-block; vertical-align: middle; width: 100%;"
>
<a
target="_blank"
href="https://pikwizard.com/photo/abstract-stock-market-and-data-analysis-in-purple-hue/6d3992c686967b2e62c7f853843403e7/"
style="text-decoration: none; font-size: 10px; margin: 0;"
>
<img src="https://pikwizard.com/pw/medium/6d3992c686967b2e62c7f853843403e7.jpg" style="margin: 0; width: 100%;" alt="" />
<p style="font-size: 12px; margin: 0;">PikWizard</p>
</a>
</span>
</span>
Free (free of charge)
Free for personal and commercial use.
Author: Creative Art
Similar Free Stock Images

Premium


Premium


Premium


Premium


Premium


Premium


Premium


Premium


Premium


Premium


Premium


Premium


Premium


Premium


Premium


Premium


Premium


Premium


Premium


Premium


Premium


Premium


Premium


Premium


Premium