- Home >
- Stock Photos >
- Agricultural Data Visualization with Overlaid Color Line Charts
Agricultural Data Visualization with Overlaid Color Line Charts Image
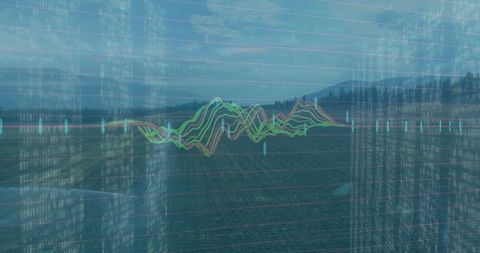
Scene presents colorful data charts blending with farmland landscape, symbolizing intersection of agriculture and technology. Using this to show agricultural progress, productivity analysis, science in farming reveals potential to describe complexities and trends in modern farming, supporting articles on advanced farming techniques, reports on agriculture analytics.
Powered by  - Get 15% off with code: PIKWIZARD15


0
downloads
downloads
Tags:
More
Credit Photo
If you would like to credit the Photo, here are some ways you can do so
Text Link
photo Link
<span class="text-link">
<span>
<a target="_blank" href=https://pikwizard.com/photo/agricultural-data-visualization-with-overlaid-color-line-charts/cb543897b8935fe9feb4c540ba5eb043/>PikWizard</a>
</span>
</span>
<span class="image-link">
<span
style="margin: 0 0 20px 0; display: inline-block; vertical-align: middle; width: 100%;"
>
<a
target="_blank"
href="https://pikwizard.com/photo/agricultural-data-visualization-with-overlaid-color-line-charts/cb543897b8935fe9feb4c540ba5eb043/"
style="text-decoration: none; font-size: 10px; margin: 0;"
>
<img src="https://pikwizard.com/pw/medium/cb543897b8935fe9feb4c540ba5eb043.jpg" style="margin: 0; width: 100%;" alt="" />
<p style="font-size: 12px; margin: 0;">PikWizard</p>
</a>
</span>
</span>
Free (free of charge)
Free for personal and commercial use.
Author: People Creations
Similar Free Stock Images

Premium


Premium


Premium


Premium


Premium


Premium


Premium


Premium


Premium


Premium


Premium


Premium


Premium


Premium


Premium


Premium


Premium


Premium


Premium


Premium


Premium


Premium


Premium


Premium