
- Home >
- Stock Photos >
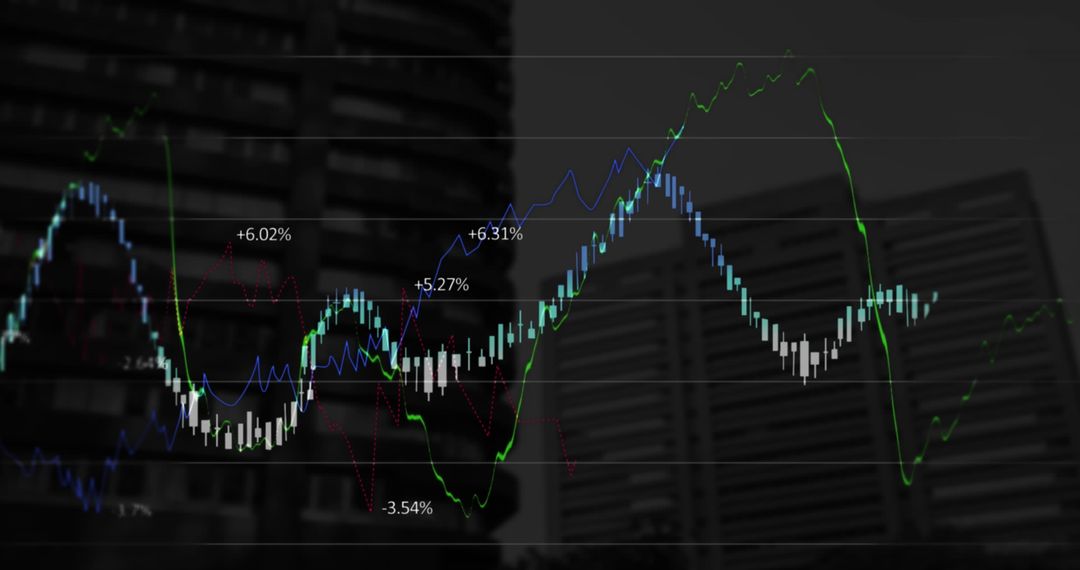
- Analyst viewing candlestick stock chart hologram with blurred businessman in suit and tie
Analyst viewing candlestick stock chart hologram with blurred businessman in suit and tie Image

Candlestick chart overlaying blurred businessman in suit and tie, showing red and green candles, vertical wicks, gridlines and numeric readout -73.52. High-tech corporate mood suitable for topics covering market volatility, trading strategies, technical analysis and financial performance. Use as website header, financial report cover, market analysis presentation, trading platform landing page, fintech app background or social media post about market downturn. Extra space on left side allowing headline or data overlay. Color palette and motion blur creating sense of urgency and digital innovation.
Powered by  - Get 15% off with code: PIKWIZARD15


0
downloads
downloads
Tags:
More
Credit Photo
If you would like to credit the Photo, here are some ways you can do so
Text Link
photo Link
<span class="text-link">
<span>
<a target="_blank" href=https://pikwizard.com/photo/analyst-viewing-candlestick-stock-chart-hologram-with-blurred-businessman-in-suit-and-tie/0bdfa1c262664cfc14613ec7e2c8775d/>PikWizard</a>
</span>
</span>
<span class="image-link">
<span
style="margin: 0 0 20px 0; display: inline-block; vertical-align: middle; width: 100%;"
>
<a
target="_blank"
href="https://pikwizard.com/photo/analyst-viewing-candlestick-stock-chart-hologram-with-blurred-businessman-in-suit-and-tie/0bdfa1c262664cfc14613ec7e2c8775d/"
style="text-decoration: none; font-size: 10px; margin: 0;"
>
<img src="https://pikwizard.com/pw/medium/0bdfa1c262664cfc14613ec7e2c8775d.jpg" style="margin: 0; width: 100%;" alt="" />
<p style="font-size: 12px; margin: 0;">PikWizard</p>
</a>
</span>
</span>
Free (free of charge)
Free for personal and commercial use.
Author: Awesome Content
Similar Free Stock Images

Premium


Premium


Premium


Premium


Premium


Premium


Premium


Premium


Premium


Premium


Premium


Premium


Premium


Premium


Premium


Premium


Premium


Premium


Premium


Premium


Premium


Premium


Premium


Premium

