- Home >
- Stock Photos >
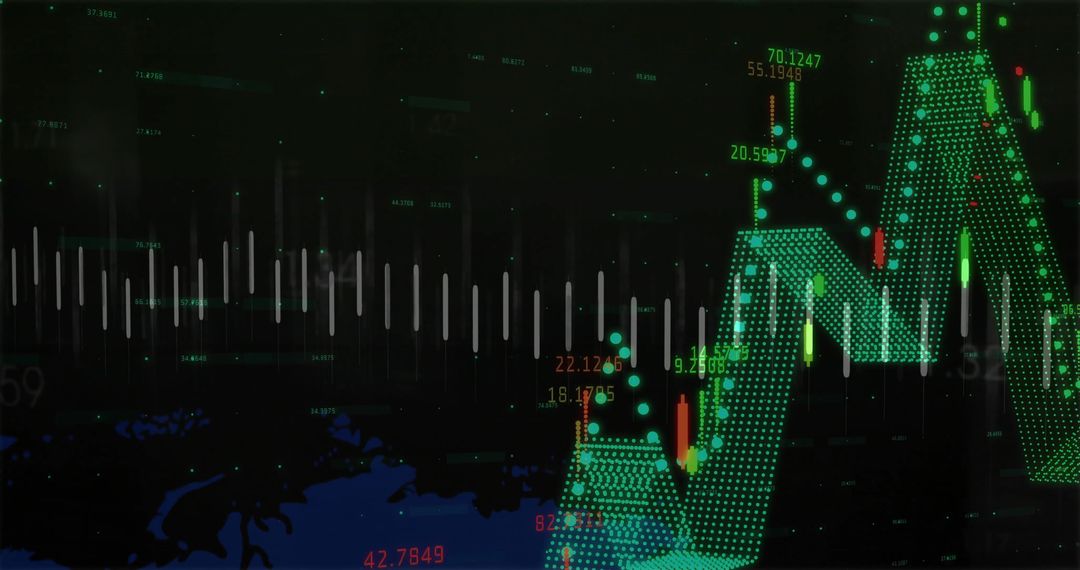
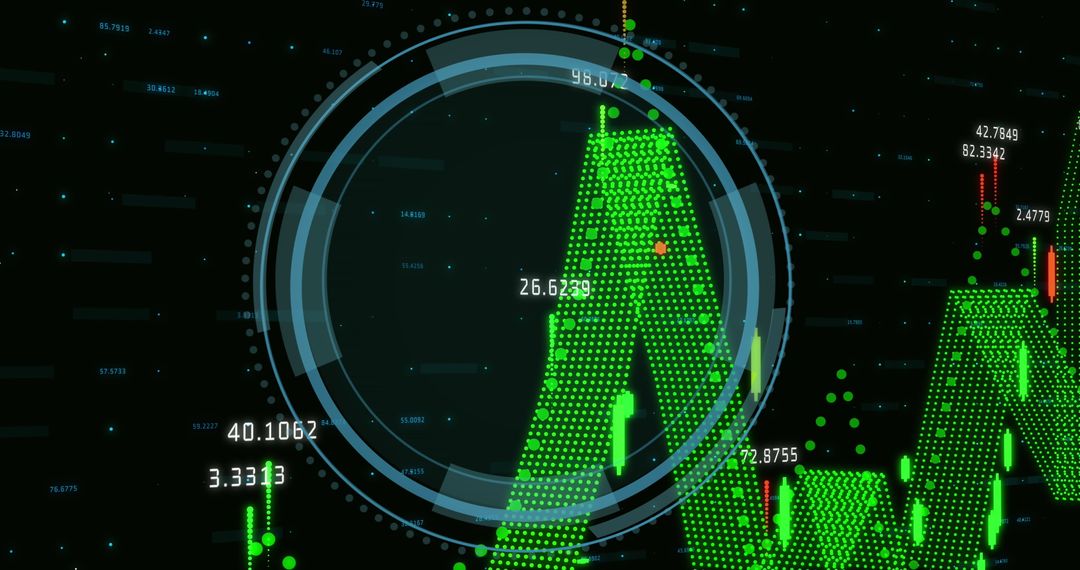
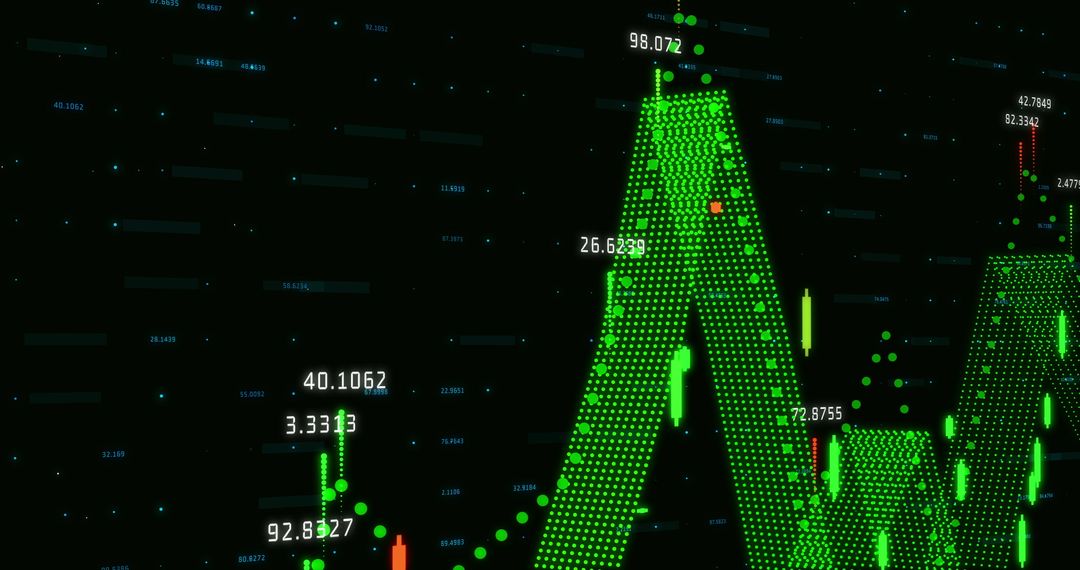
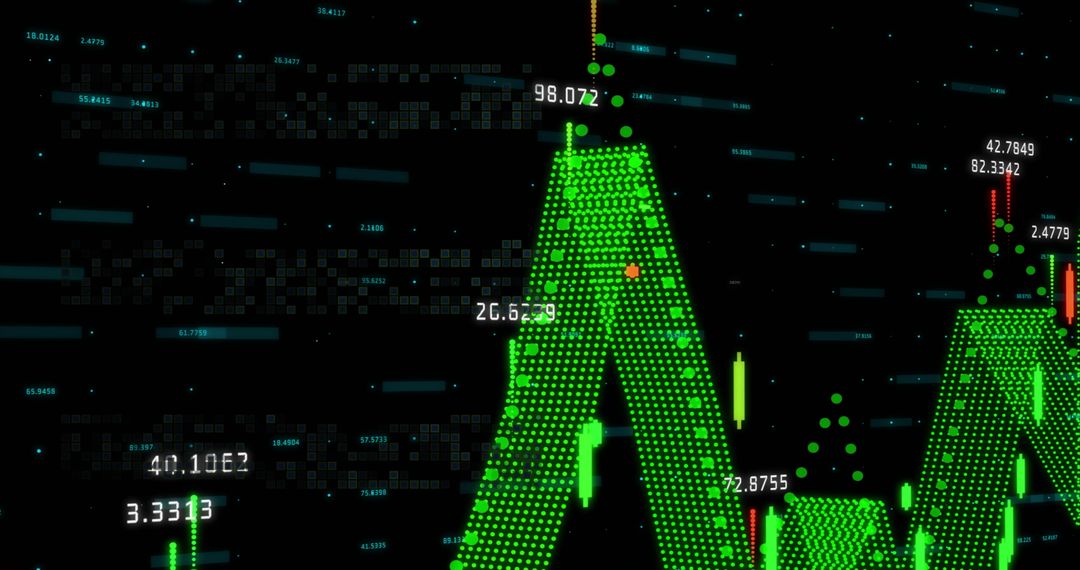
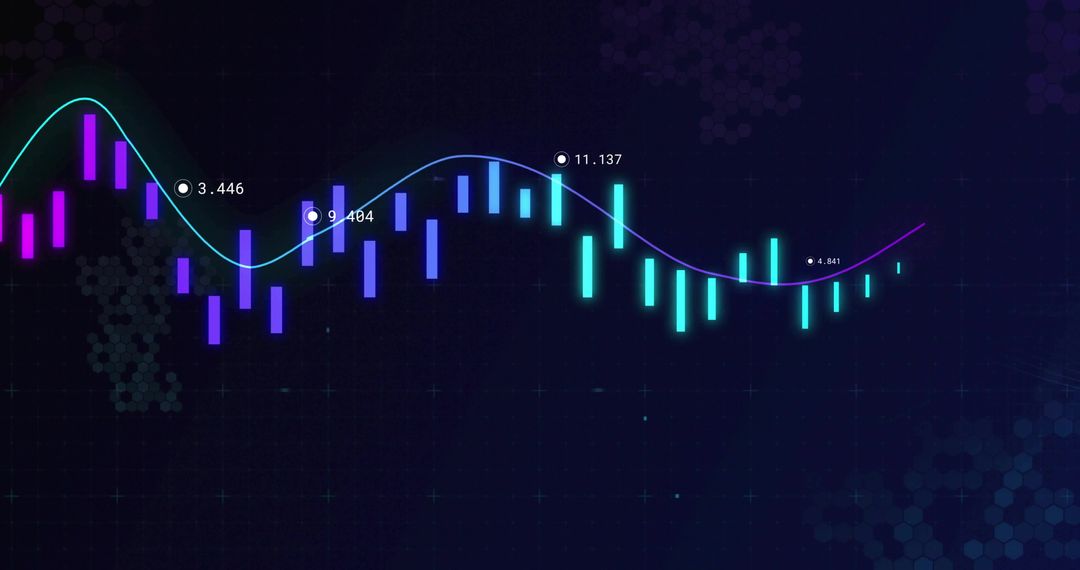
- Analytical Dashboard with Candlestick Chart and Dotted Trend Line
Analytical Dashboard with Candlestick Chart and Dotted Trend Line Image

Designed by integrating elements of advanced digital charting, this resource charts market data draws on bundling of analytic insights. This could benefit financial tech startups designing user interfaces, analysts conveying dynamic trending data, or educators elucidating financial fluctuations.
Powered by  - Get 15% off with code: PIKWIZARD15


0
downloads
downloads
Tags:
More
Credit Photo
If you would like to credit the Photo, here are some ways you can do so
Text Link
photo Link
<span class="text-link">
<span>
<a target="_blank" href=https://pikwizard.com/photo/analytical-dashboard-with-candlestick-chart-and-dotted-trend-line/6857f97e8977b5918beee8eadb317453/>PikWizard</a>
</span>
</span>
<span class="image-link">
<span
style="margin: 0 0 20px 0; display: inline-block; vertical-align: middle; width: 100%;"
>
<a
target="_blank"
href="https://pikwizard.com/photo/analytical-dashboard-with-candlestick-chart-and-dotted-trend-line/6857f97e8977b5918beee8eadb317453/"
style="text-decoration: none; font-size: 10px; margin: 0;"
>
<img src="https://pikwizard.com/pw/medium/6857f97e8977b5918beee8eadb317453.jpg" style="margin: 0; width: 100%;" alt="" />
<p style="font-size: 12px; margin: 0;">PikWizard</p>
</a>
</span>
</span>
Free (free of charge)
Free for personal and commercial use.
Author: Authentic Images
Similar Free Stock Images
Premium


Premium


Premium


Premium


Premium


Premium


Premium


Premium


Premium


Premium


Premium


Premium


Premium


Premium


Premium


Premium


Premium


Premium


Premium


Premium


Premium


Premium


Premium


Premium