
- Home >
- Stock Photos >
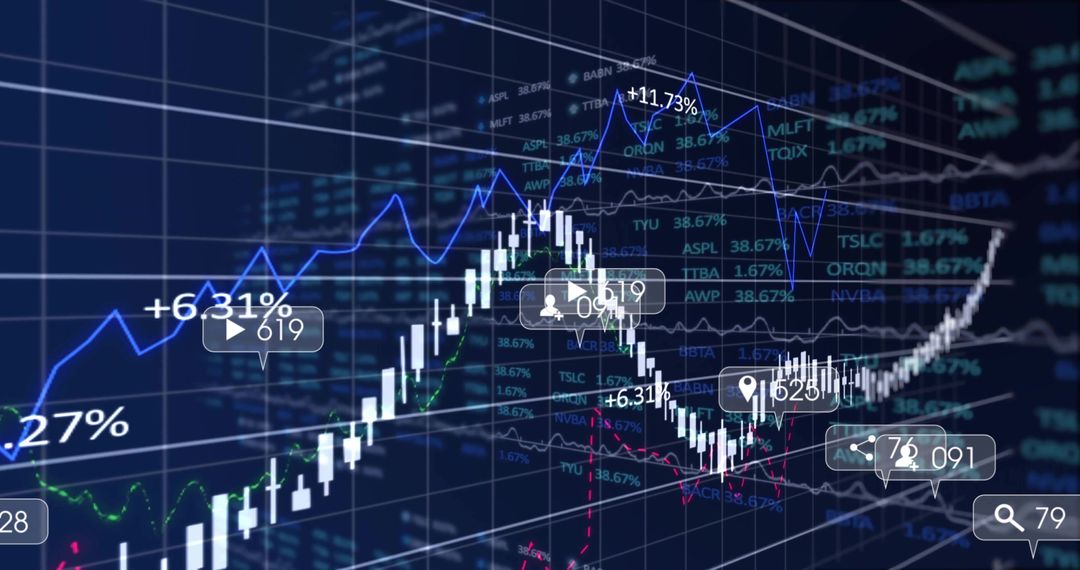
- Analytical Trading Dashboard with Rising Candlestick Charts
Analytical Trading Dashboard with Rising Candlestick Charts Image

Illustrates dynamic financial analytics with rising candlestick charts on a trading dashboard. Represents data-driven decision-making and stock market investment. Ideal for presentations, articles on financial technology, market analysis, and digital strategies in finance.
Powered by 


0
downloads
downloads
Tags:
More
Credit Photo
If you would like to credit the Photo, here are some ways you can do so
Text Link
photo Link
<span class="text-link">
<span>
<a target="_blank" href=https://pikwizard.com/photo/analytical-trading-dashboard-with-rising-candlestick-charts/ab7448e8ee06cd2b08daa9c930e25785/>PikWizard</a>
</span>
</span>
<span class="image-link">
<span
style="margin: 0 0 20px 0; display: inline-block; vertical-align: middle; width: 100%;"
>
<a
target="_blank"
href="https://pikwizard.com/photo/analytical-trading-dashboard-with-rising-candlestick-charts/ab7448e8ee06cd2b08daa9c930e25785/"
style="text-decoration: none; font-size: 10px; margin: 0;"
>
<img src="https://pikwizard.com/pw/medium/ab7448e8ee06cd2b08daa9c930e25785.jpg" style="margin: 0; width: 100%;" alt="" />
<p style="font-size: 12px; margin: 0;">PikWizard</p>
</a>
</span>
</span>
Free (free of charge)
Free for personal and commercial use.
Author: Creative Art
Similar Free Stock Images

Premium


Premium


Premium


Premium


Premium


Premium


Premium


Premium


Premium


Premium


Premium


Premium


Premium


Premium


Premium


Premium


Premium


Premium


Premium


Premium


Premium


Premium


Premium


Premium

