- Home >
- Stock Photos >
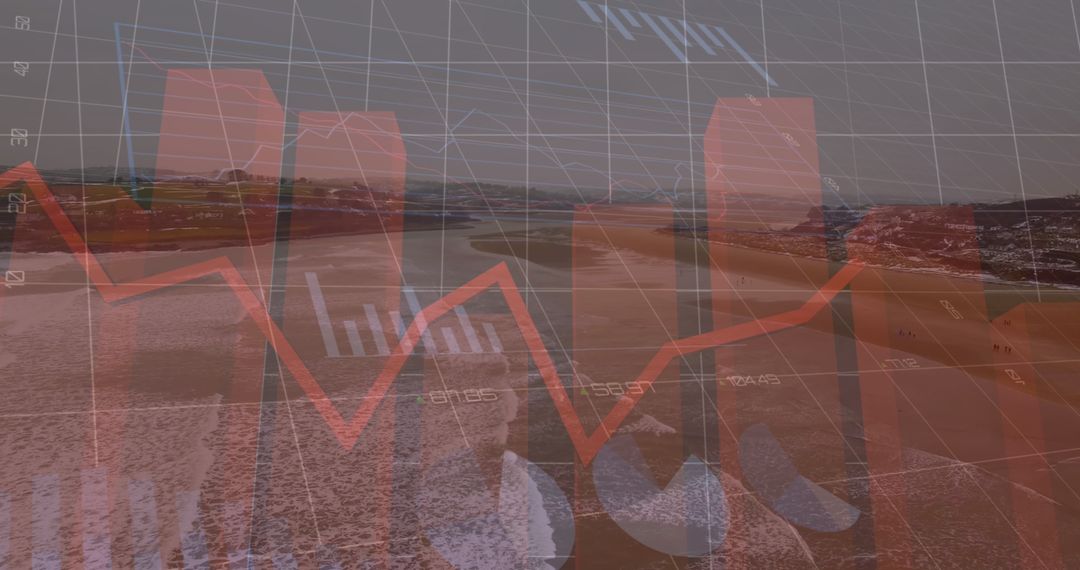
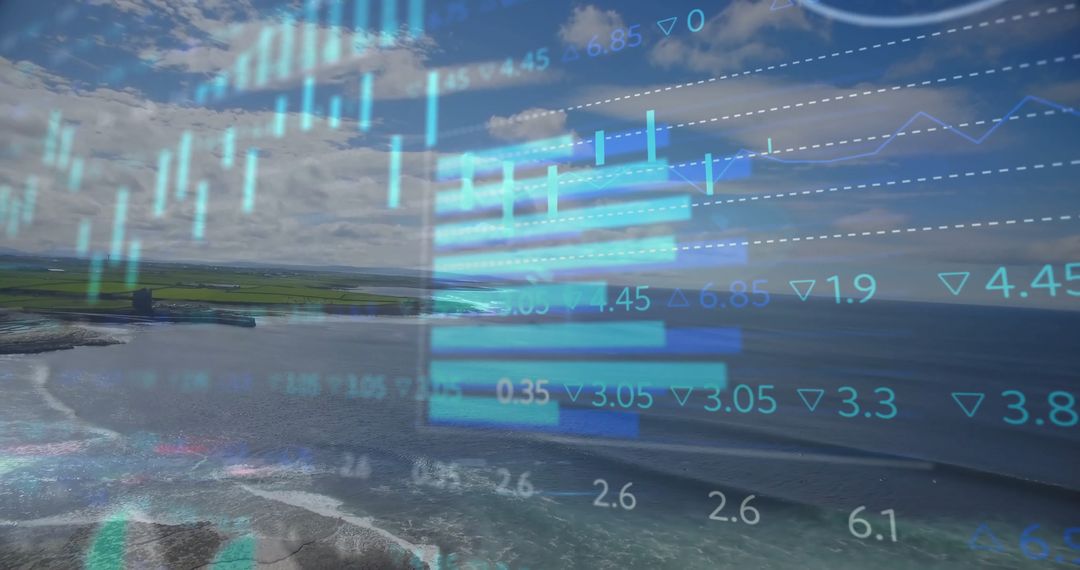
- Analyzing Coastal Data via Digital Interface with Bar Charts and Graphs
Analyzing Coastal Data via Digital Interface with Bar Charts and Graphs Image

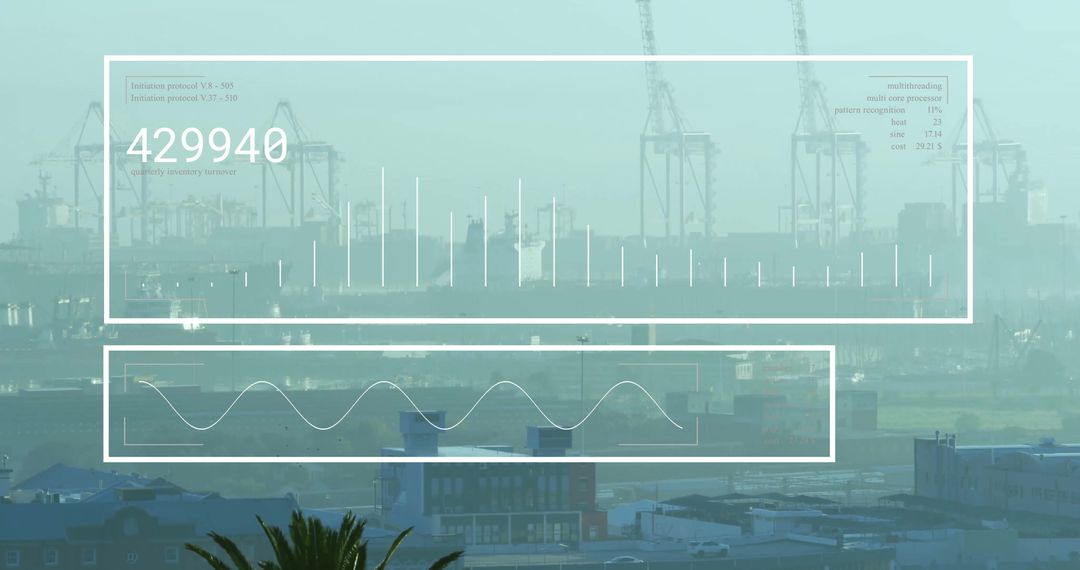
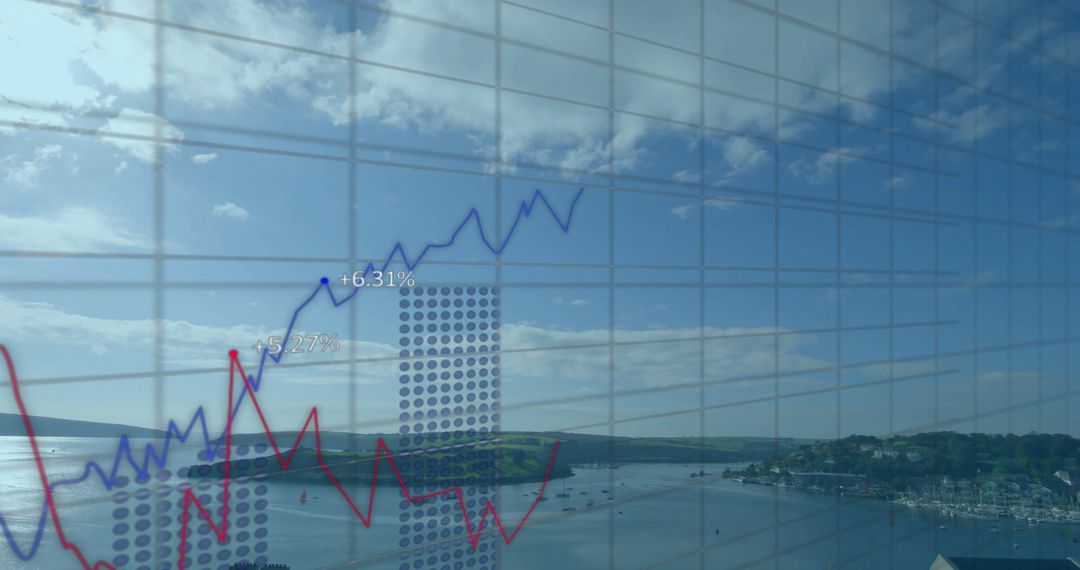
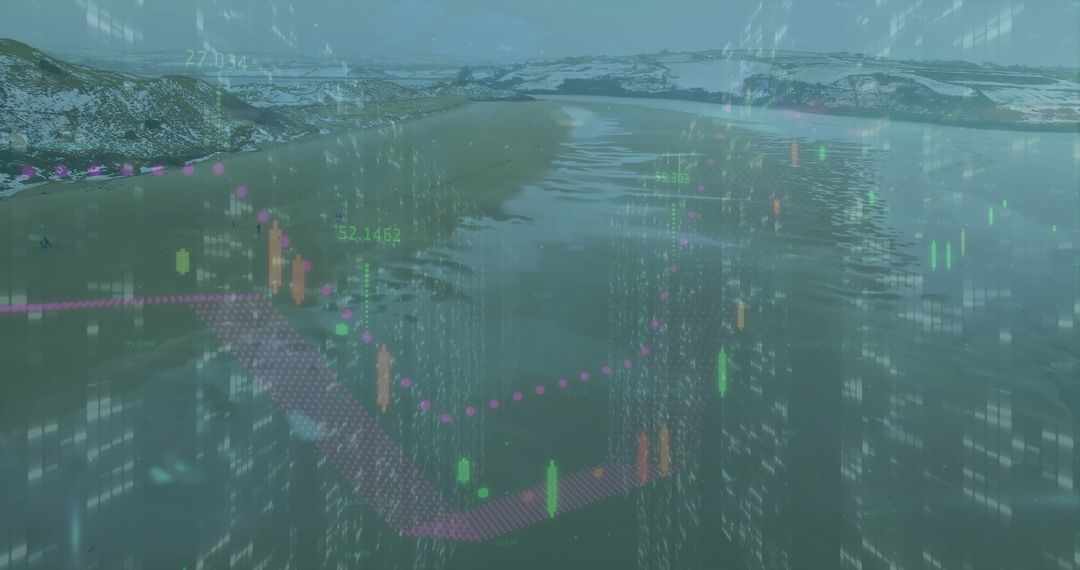
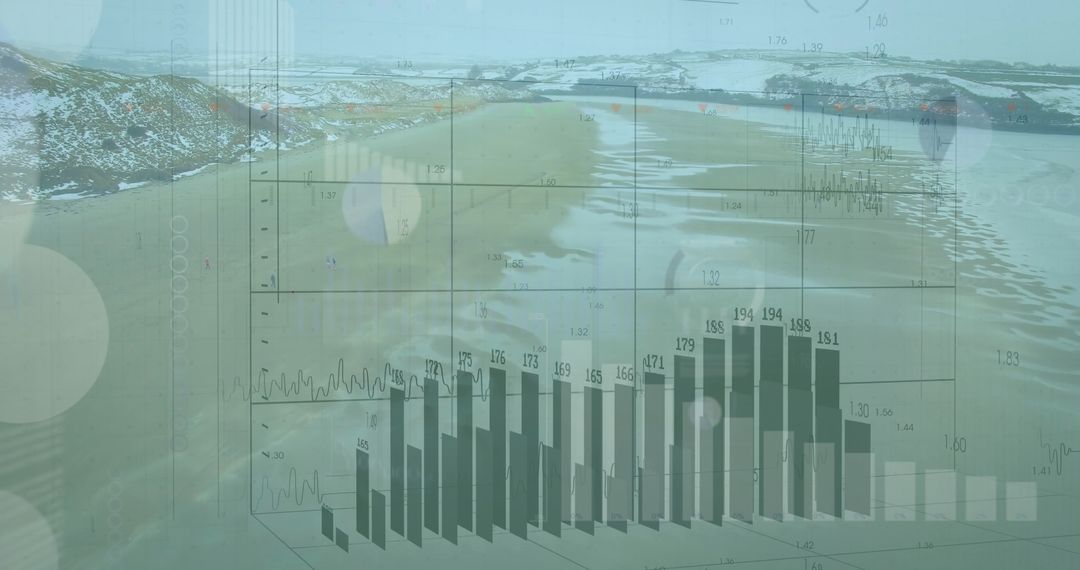
This image combines a serene coastal landscape with abstract overlays of digital analytics, utilizing bar charts and multicolor lines to suggest data interpretation. Ideal for illustrating themes related to marine research, environmental monitoring, or digital technology in a natural context, this visual could enhance presentations, reports, or articles discussing modern data analysis techniques on environmental issues.
Powered by 


0
downloads
downloads
Tags:
More
Credit Photo
If you would like to credit the Photo, here are some ways you can do so
Text Link
photo Link
<span class="text-link">
<span>
<a target="_blank" href=https://pikwizard.com/photo/analyzing-coastal-data-via-digital-interface-with-bar-charts-and-graphs/6fac52a72c68f7a0f4325db8e60530f6/>PikWizard</a>
</span>
</span>
<span class="image-link">
<span
style="margin: 0 0 20px 0; display: inline-block; vertical-align: middle; width: 100%;"
>
<a
target="_blank"
href="https://pikwizard.com/photo/analyzing-coastal-data-via-digital-interface-with-bar-charts-and-graphs/6fac52a72c68f7a0f4325db8e60530f6/"
style="text-decoration: none; font-size: 10px; margin: 0;"
>
<img src="https://pikwizard.com/pw/medium/6fac52a72c68f7a0f4325db8e60530f6.jpg" style="margin: 0; width: 100%;" alt="" />
<p style="font-size: 12px; margin: 0;">PikWizard</p>
</a>
</span>
</span>
Free (free of charge)
Free for personal and commercial use.
Author: Creative Art
Similar Free Stock Images