- Home >
- Stock Photos >
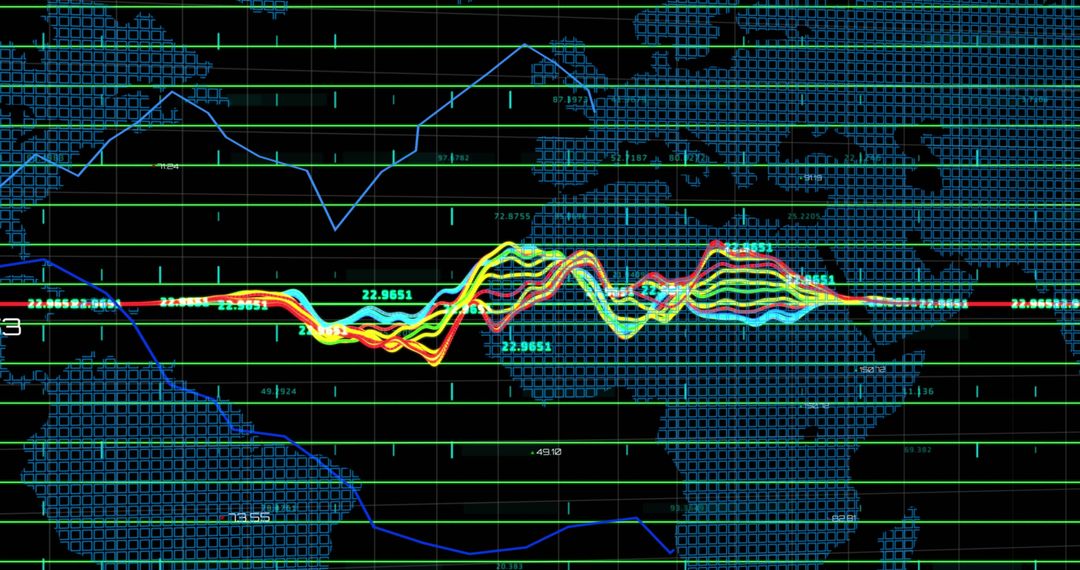
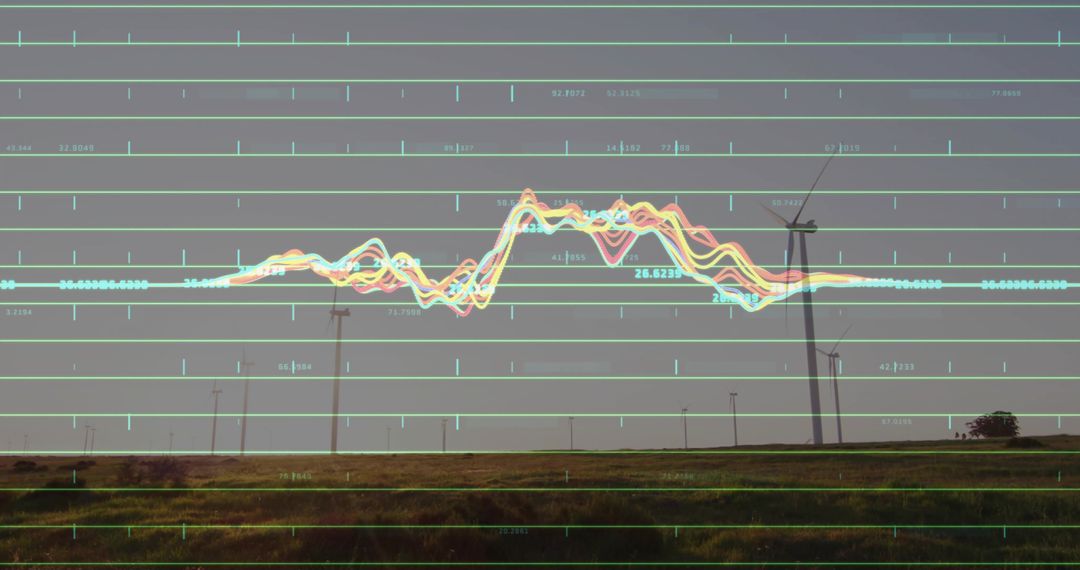
- Analyzing Complex Financial Data and Market Trends
Analyzing Complex Financial Data and Market Trends Image

Illustrating complex financial data and market trends suitable for business presentations, economic research, financial analysis, and educational materials. Ideal for conveying advanced data-processing concepts and interpreting business connections worldwide.
Powered by 


2
downloads
downloads
Tags:
More
Credit Photo
If you would like to credit the Photo, here are some ways you can do so
Text Link
photo Link
<span class="text-link">
<span>
<a target="_blank" href=https://pikwizard.com/photo/analyzing-complex-financial-data-and-market-trends/2300ad0ad05274cfaaab140c49972cf8/>PikWizard</a>
</span>
</span>
<span class="image-link">
<span
style="margin: 0 0 20px 0; display: inline-block; vertical-align: middle; width: 100%;"
>
<a
target="_blank"
href="https://pikwizard.com/photo/analyzing-complex-financial-data-and-market-trends/2300ad0ad05274cfaaab140c49972cf8/"
style="text-decoration: none; font-size: 10px; margin: 0;"
>
<img src="https://pikwizard.com/pw/medium/2300ad0ad05274cfaaab140c49972cf8.jpg" style="margin: 0; width: 100%;" alt="" />
<p style="font-size: 12px; margin: 0;">PikWizard</p>
</a>
</span>
</span>
Free (free of charge)
Free for personal and commercial use.
Author: People Creations
Similar Free Stock Images

Premium


Premium


Premium


Premium


Premium


Premium


Premium


Premium


Premium


Premium


Premium


Premium


Premium


Premium


Premium


Premium


Premium


Premium


Premium


Premium


Premium


Premium


Premium


Premium