- Home >
- Stock Photos >
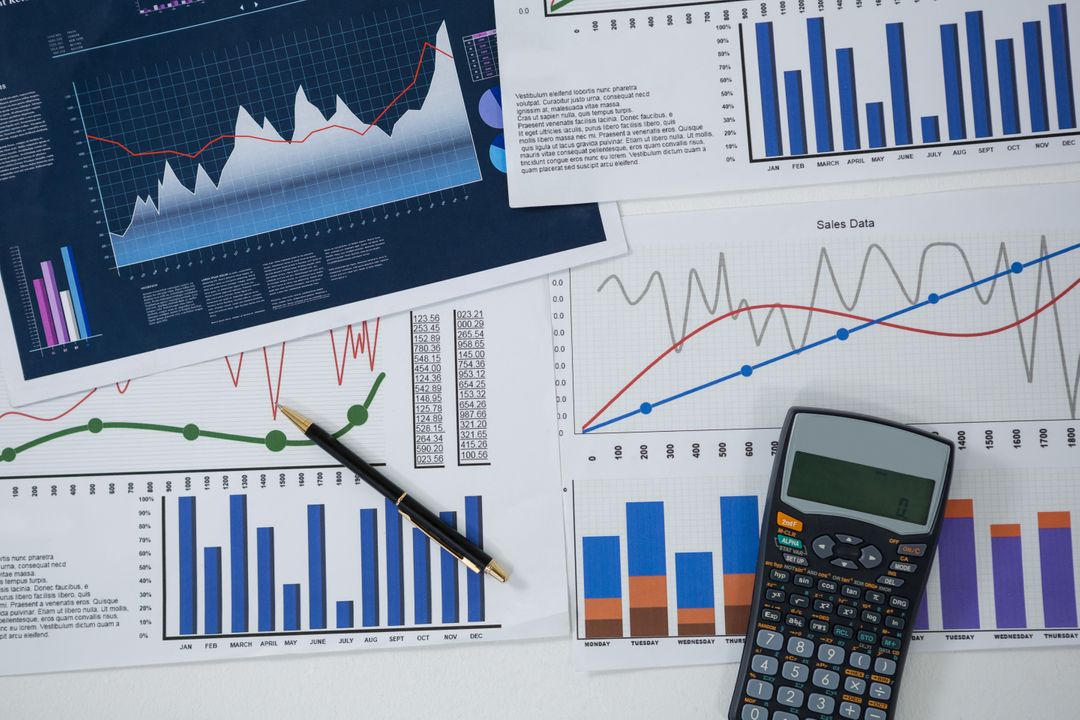
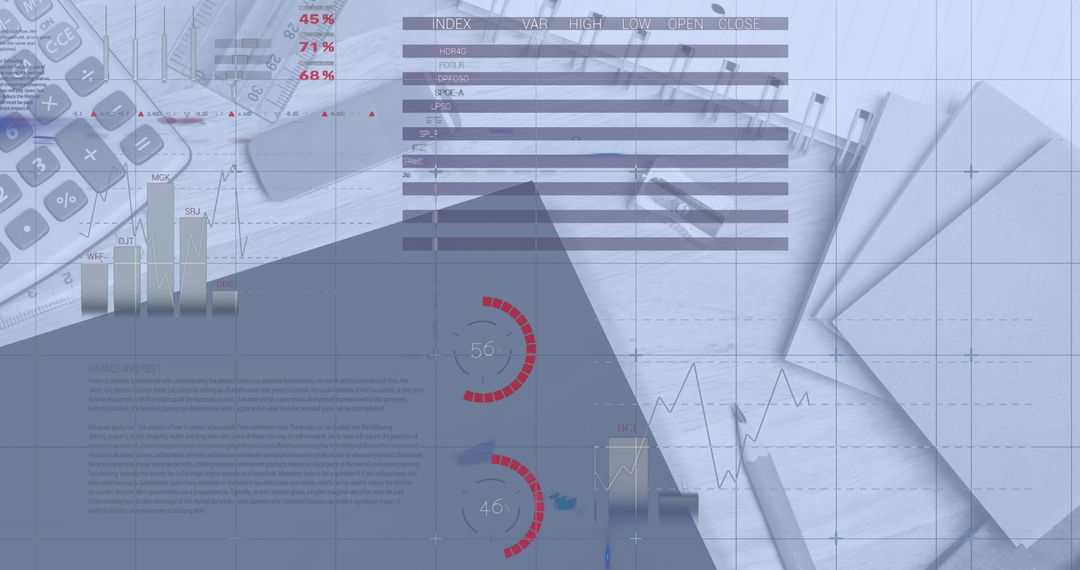
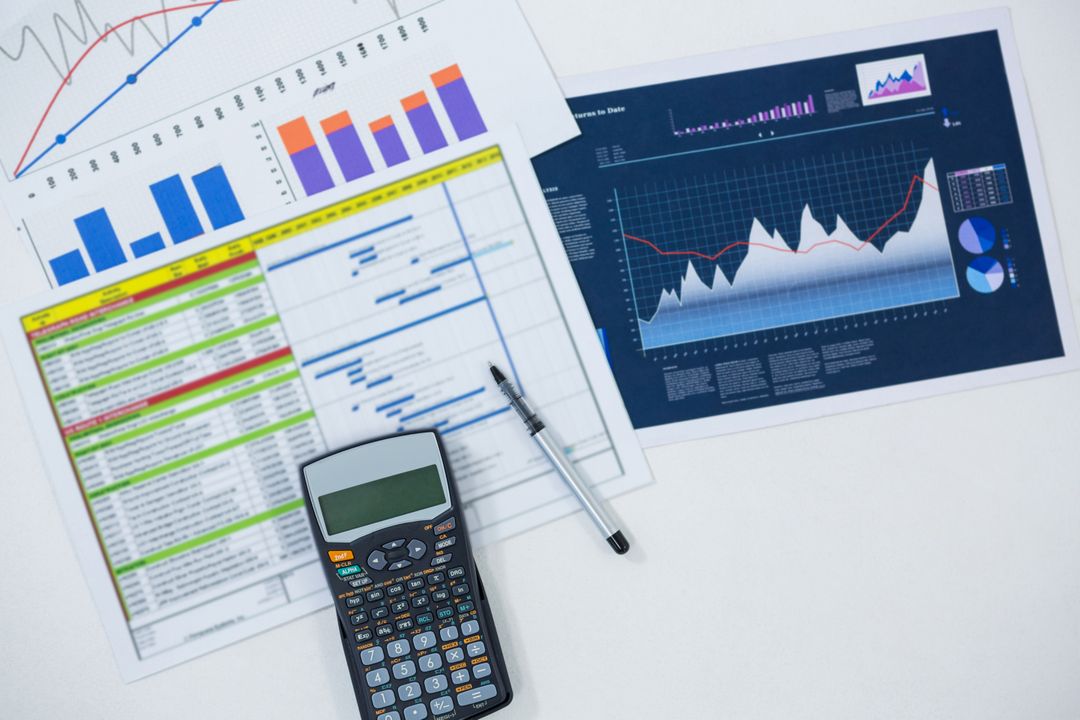
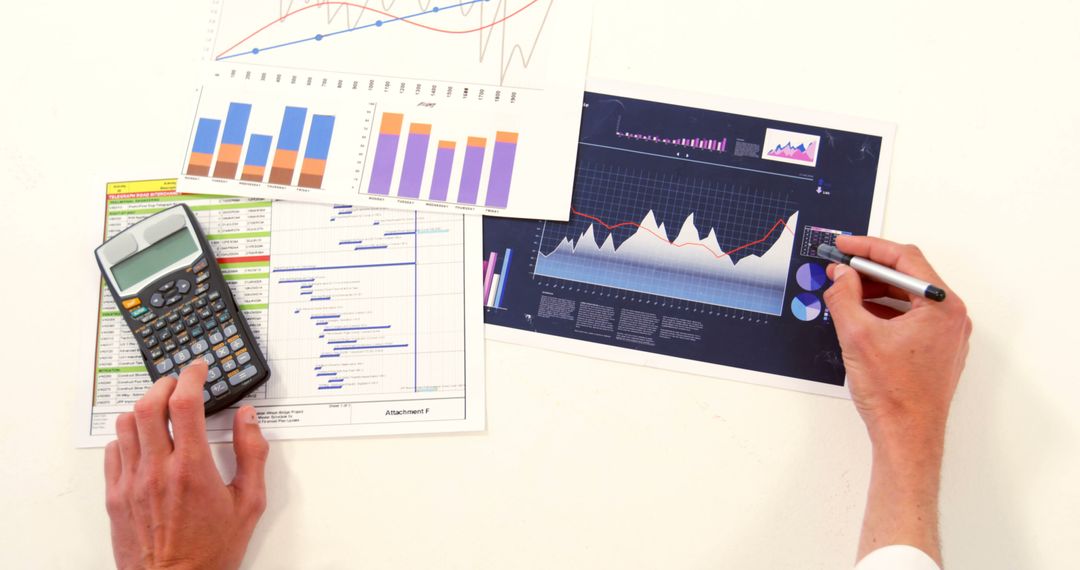
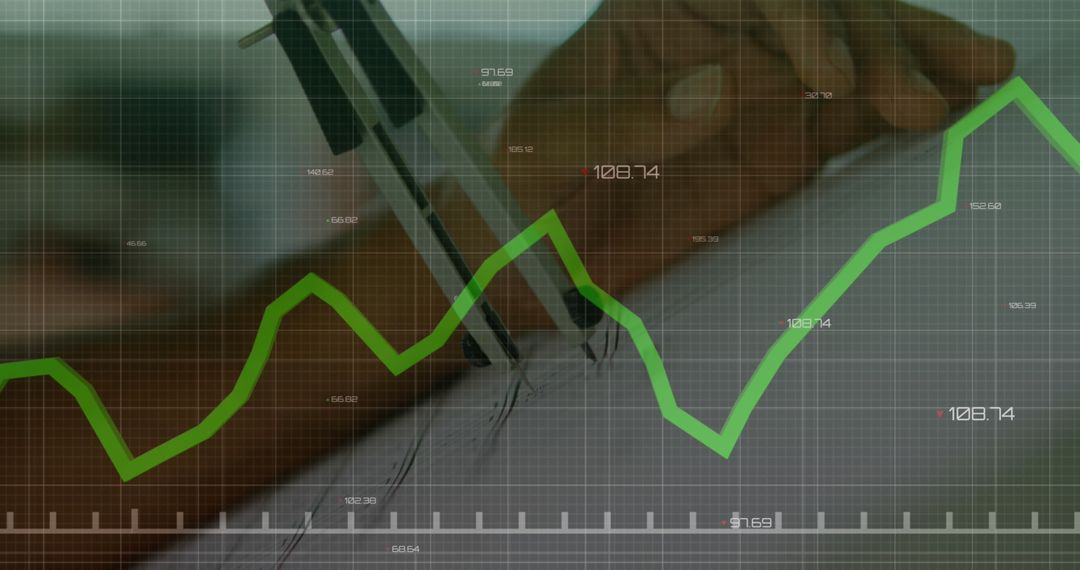
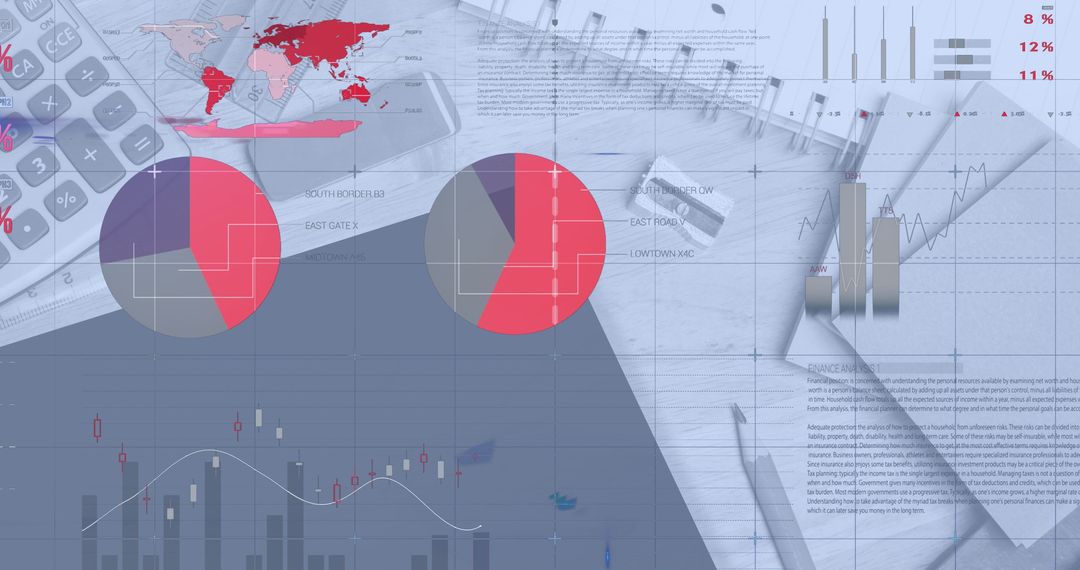
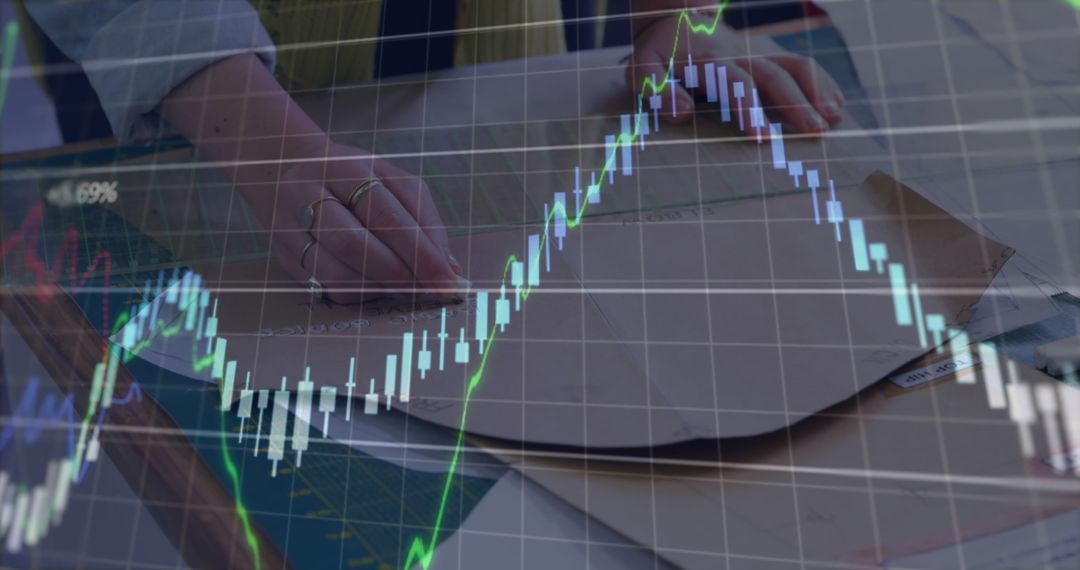
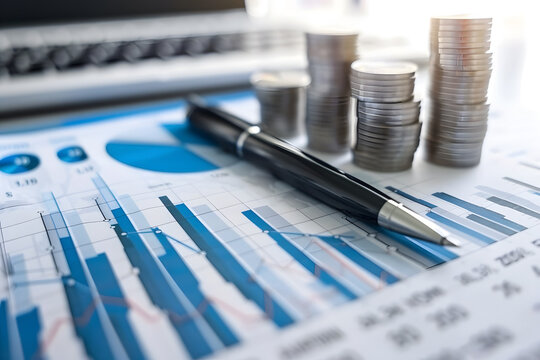
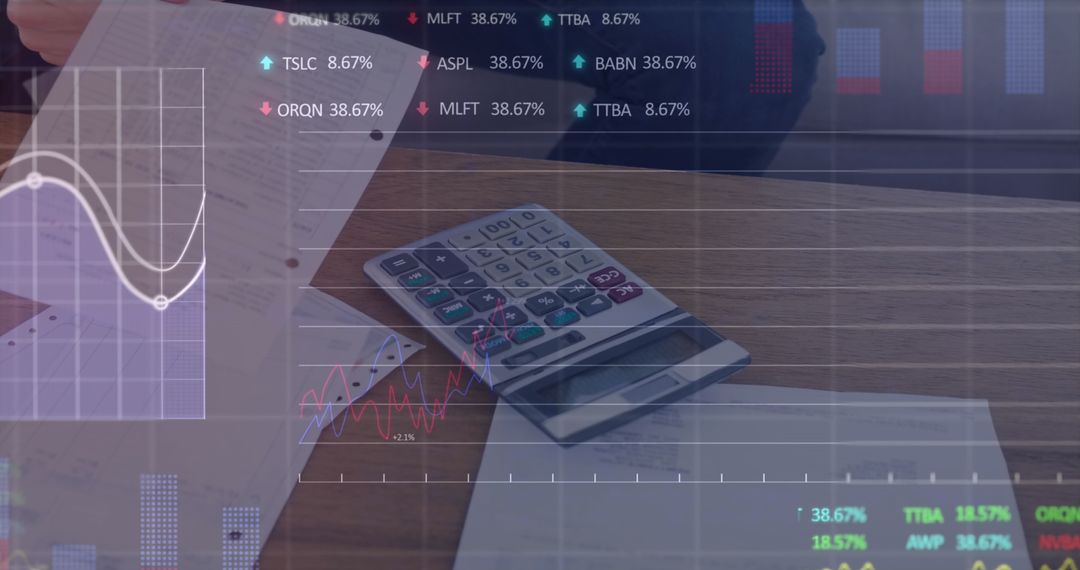
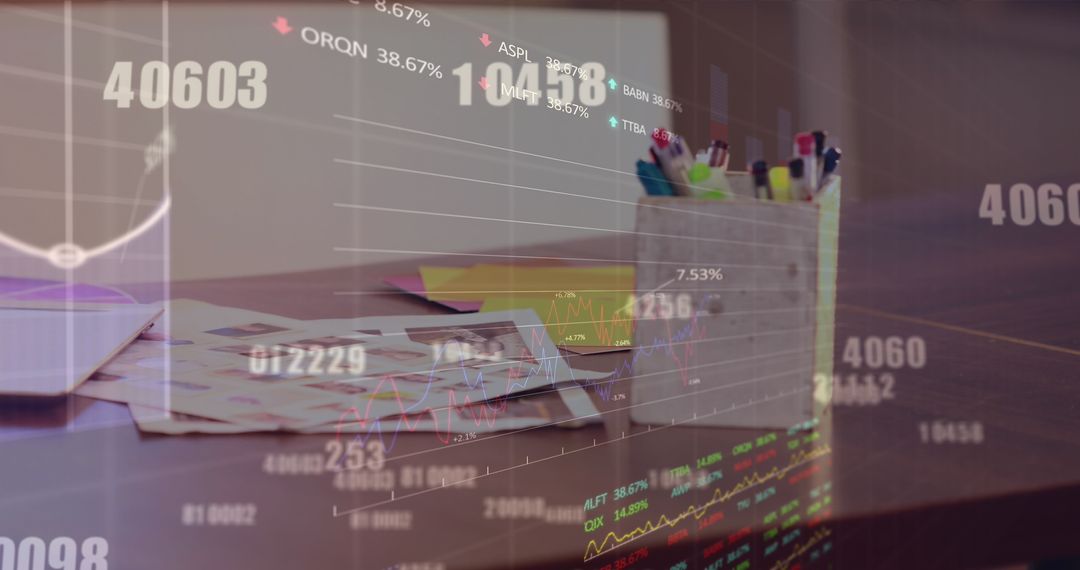
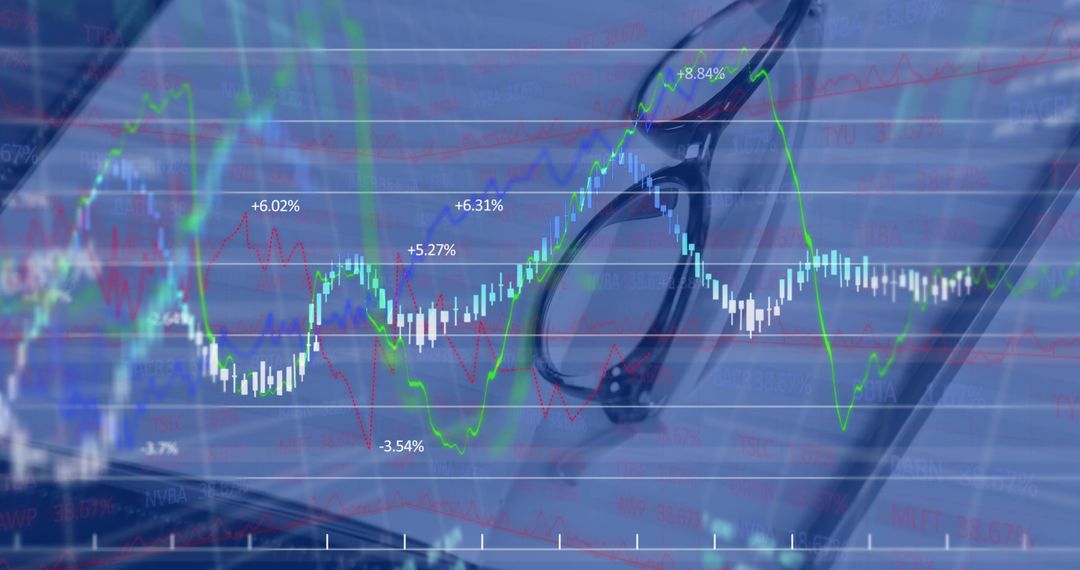
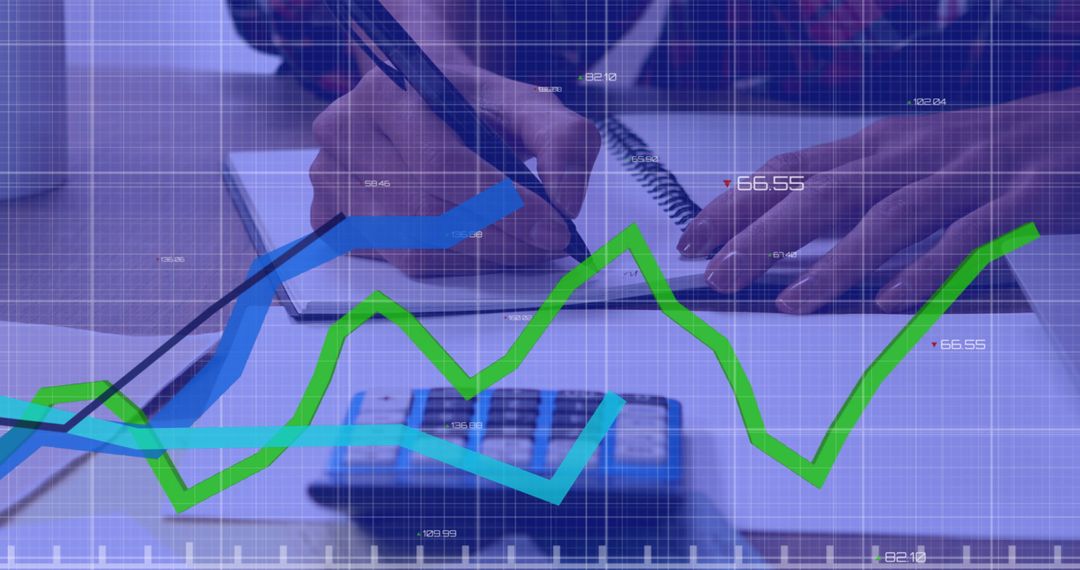
- Analyzing Economic Data Finance with Calculator and Documents
Analyzing Economic Data Finance with Calculator and Documents Image
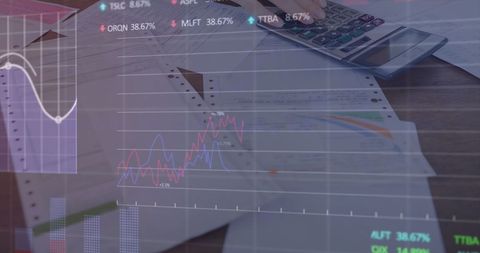
This illustration shows the process of financial analysis and economic data interpretation with an emphasis on budgeting and reporting. Graph overlays on financial documents highlight data visualization within the finance and business sectors. Perfect for presentations, articles or blog posts related to finance, budgeting strategies, stock market analysis, or economic reporting.
Powered by 


2
downloads
downloads
Tags:
More
Credit Photo
If you would like to credit the Photo, here are some ways you can do so
Text Link
photo Link
<span class="text-link">
<span>
<a target="_blank" href=https://pikwizard.com/photo/analyzing-economic-data-finance-with-calculator-and-documents/07f5a4c2ac3d870d7cb9bba0190a7f84/>PikWizard</a>
</span>
</span>
<span class="image-link">
<span
style="margin: 0 0 20px 0; display: inline-block; vertical-align: middle; width: 100%;"
>
<a
target="_blank"
href="https://pikwizard.com/photo/analyzing-economic-data-finance-with-calculator-and-documents/07f5a4c2ac3d870d7cb9bba0190a7f84/"
style="text-decoration: none; font-size: 10px; margin: 0;"
>
<img src="https://pikwizard.com/pw/medium/07f5a4c2ac3d870d7cb9bba0190a7f84.jpg" style="margin: 0; width: 100%;" alt="" />
<p style="font-size: 12px; margin: 0;">PikWizard</p>
</a>
</span>
</span>
Free (free of charge)
Free for personal and commercial use.
Author: Authentic Images
Similar Free Stock Images
Premium


Premium


Premium


Premium


Premium


Premium


Premium


Premium


Premium


Premium


Premium


Premium


Premium


Premium


Premium


Premium


Premium


Premium


Premium


Premium


Premium


Premium


Premium


Premium