- Home >
- Stock Photos >
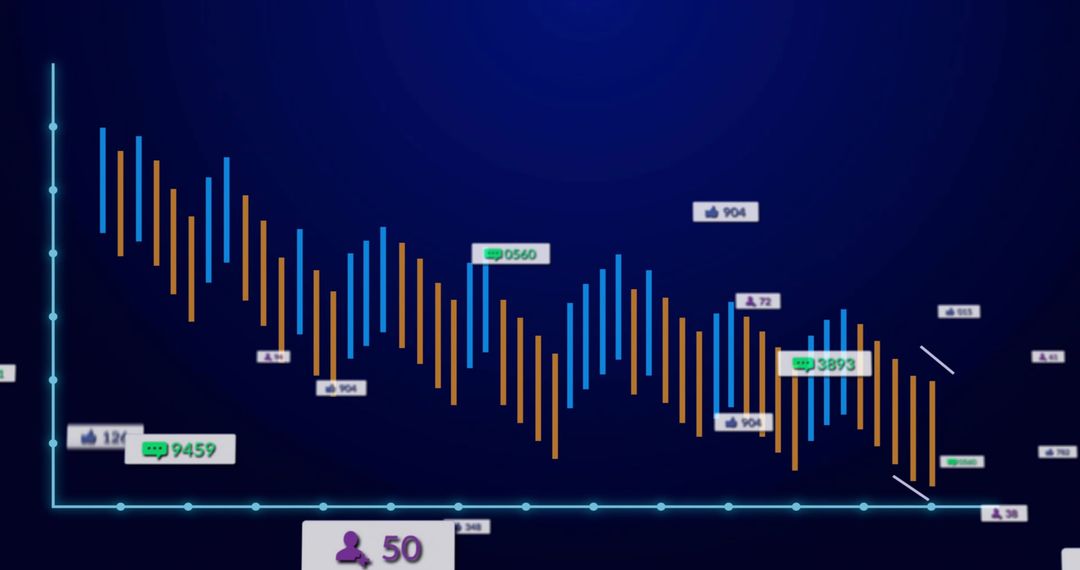
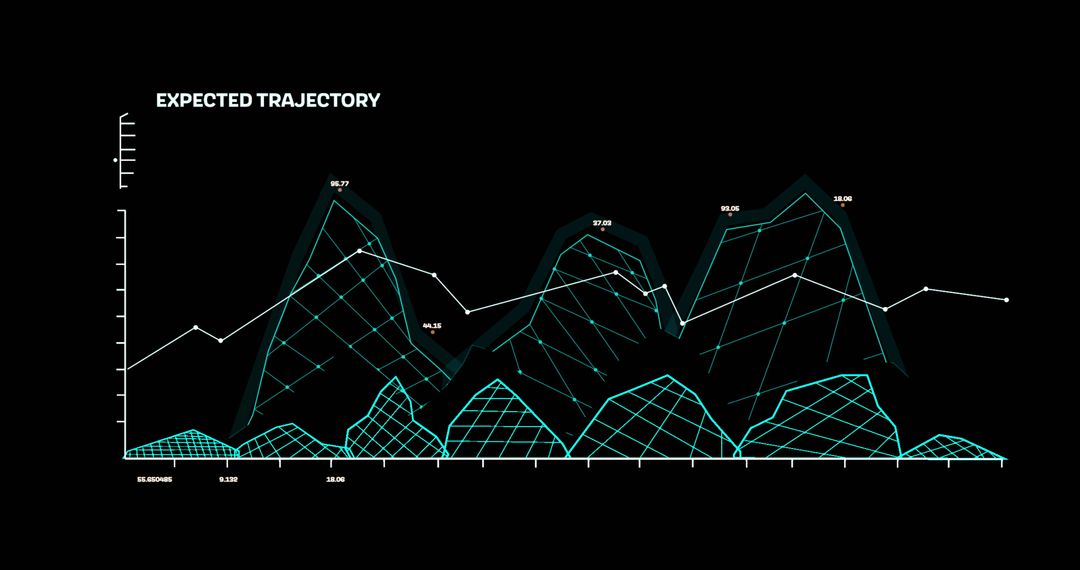
- Analyzing Financial Data and Growth Metrics Illustration
Analyzing Financial Data and Growth Metrics Illustration Image

Illustration displays complex data analysis using graph and waveforms on black backdrop, suggesting financial growth and technological interface. Perfect for presentations on economy growth, financial technology, data analysis, and modern finance solutions. Ideal for articles or educational materials about digital transformations in finance.
Powered by 


2
downloads
downloads
Tags:
More
Credit Photo
If you would like to credit the Photo, here are some ways you can do so
Text Link
photo Link
<span class="text-link">
<span>
<a target="_blank" href=https://pikwizard.com/photo/analyzing-financial-data-and-growth-metrics-illustration/8b1b1e785274d961afe45d2938d608e5/>PikWizard</a>
</span>
</span>
<span class="image-link">
<span
style="margin: 0 0 20px 0; display: inline-block; vertical-align: middle; width: 100%;"
>
<a
target="_blank"
href="https://pikwizard.com/photo/analyzing-financial-data-and-growth-metrics-illustration/8b1b1e785274d961afe45d2938d608e5/"
style="text-decoration: none; font-size: 10px; margin: 0;"
>
<img src="https://pikwizard.com/pw/medium/8b1b1e785274d961afe45d2938d608e5.jpg" style="margin: 0; width: 100%;" alt="" />
<p style="font-size: 12px; margin: 0;">PikWizard</p>
</a>
</span>
</span>
Free (free of charge)
Free for personal and commercial use.
Author: Awesome Content
Similar Free Stock Images

Premium


Premium


Premium


Premium


Premium


Premium


Premium


Premium


Premium


Premium


Premium


Premium


Premium


Premium


Premium


Premium


Premium


Premium


Premium


Premium


Premium


Premium


Premium


Premium