
- Home >
- Stock Photos >
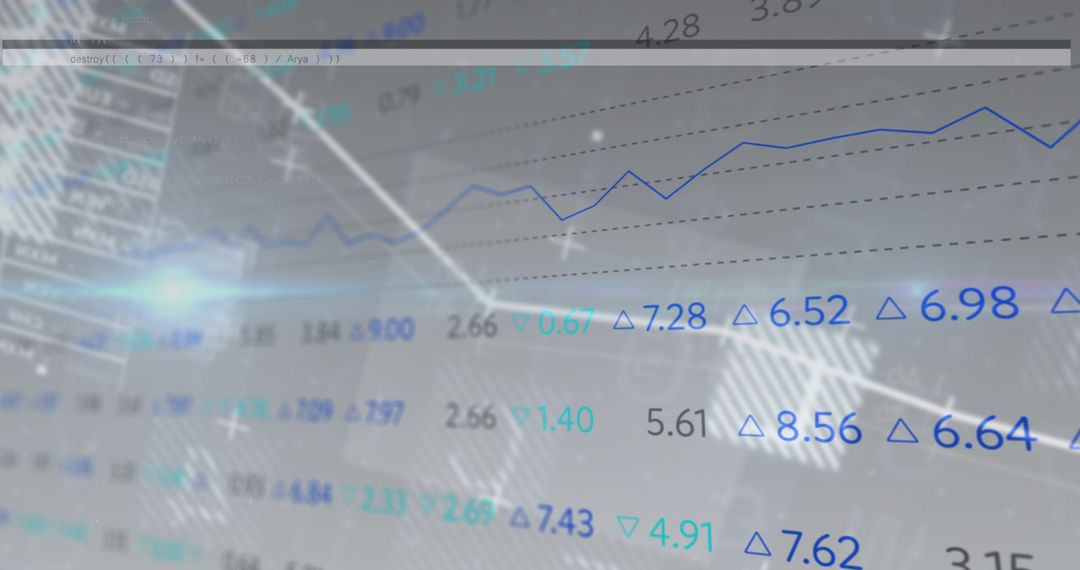
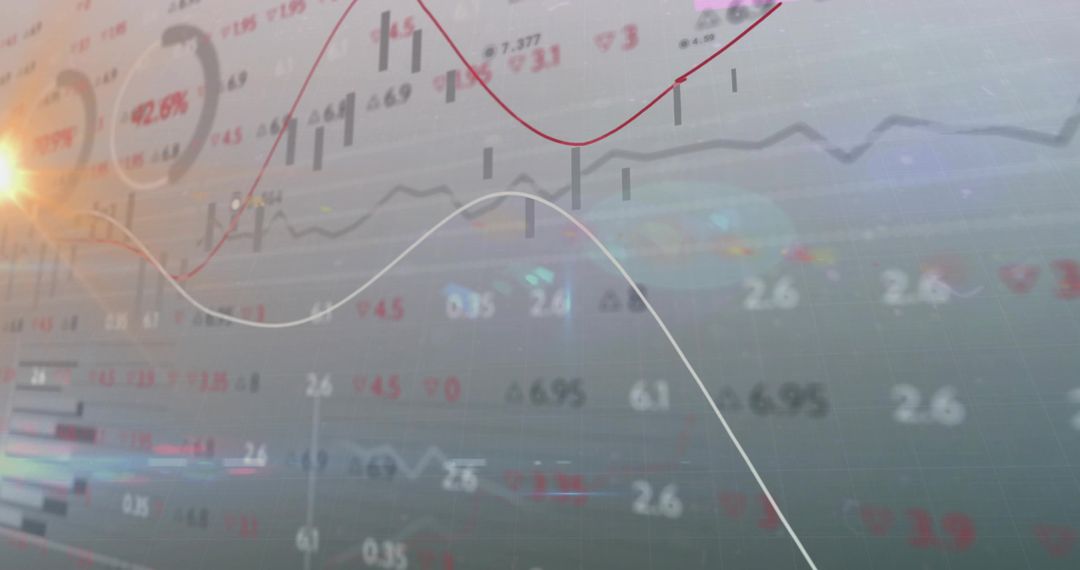
- Analyzing Financial Data and Statistics for Business Insights
Analyzing Financial Data and Statistics for Business Insights Image

Abstract representation of financial analytics involving graphs, charts, and numerical data inspire modern business solutions. Ideal for illustrating market analysis, corporate presentations, digital economy discussions, or promoting financial technology tools.
Powered by 


2
downloads
downloads
Tags:
More
Credit Photo
If you would like to credit the Photo, here are some ways you can do so
Text Link
photo Link
<span class="text-link">
<span>
<a target="_blank" href=https://pikwizard.com/photo/analyzing-financial-data-and-statistics-for-business-insights/381d174b467ee15b4f580a310a1c48e2/>PikWizard</a>
</span>
</span>
<span class="image-link">
<span
style="margin: 0 0 20px 0; display: inline-block; vertical-align: middle; width: 100%;"
>
<a
target="_blank"
href="https://pikwizard.com/photo/analyzing-financial-data-and-statistics-for-business-insights/381d174b467ee15b4f580a310a1c48e2/"
style="text-decoration: none; font-size: 10px; margin: 0;"
>
<img src="https://pikwizard.com/pw/medium/381d174b467ee15b4f580a310a1c48e2.jpg" style="margin: 0; width: 100%;" alt="" />
<p style="font-size: 12px; margin: 0;">PikWizard</p>
</a>
</span>
</span>
Free (free of charge)
Free for personal and commercial use.
Author: Creative Art
Similar Free Stock Images

Premium


Premium


Premium


Premium


Premium


Premium


Premium


Premium


Premium


Premium


Premium


Premium


Premium


Premium


Premium


Premium


Premium


Premium


Premium


Premium


Premium


Premium


Premium


Premium

