- Home >
- Stock Photos >
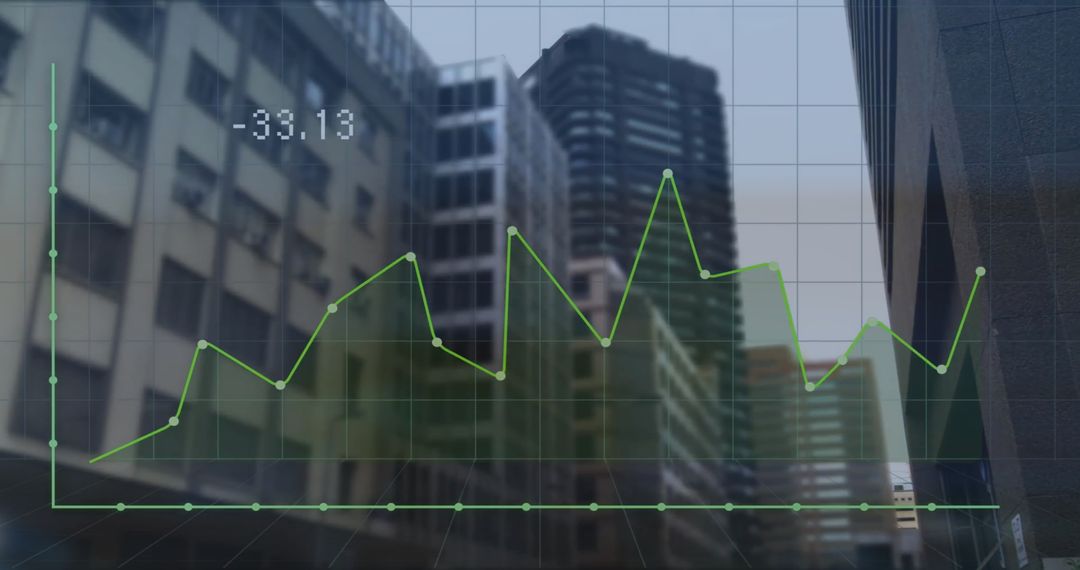
- Analyzing Financial Data with Business Charts Against Urban Skyline
Analyzing Financial Data with Business Charts Against Urban Skyline Image

Vibrant graphic depicting the intricate processing of financial data, with charts and numerical information overlaid on architectural elements. Viewed from a low angle, the image highlights the blending of the physical financial centers and digital data landscape. Useful for illustrating concepts about global finance, analytic technologies, and business operations in a corporate environment.
Powered by  - Get 15% off with code: PIKWIZARD15


2
downloads
downloads
Tags:
More
Credit Photo
If you would like to credit the Photo, here are some ways you can do so
Text Link
photo Link
<span class="text-link">
<span>
<a target="_blank" href=https://pikwizard.com/photo/analyzing-financial-data-with-business-charts-against-urban-skyline/c58caf06624495f3c3f1ddb81a46e0e1/>PikWizard</a>
</span>
</span>
<span class="image-link">
<span
style="margin: 0 0 20px 0; display: inline-block; vertical-align: middle; width: 100%;"
>
<a
target="_blank"
href="https://pikwizard.com/photo/analyzing-financial-data-with-business-charts-against-urban-skyline/c58caf06624495f3c3f1ddb81a46e0e1/"
style="text-decoration: none; font-size: 10px; margin: 0;"
>
<img src="https://pikwizard.com/pw/medium/c58caf06624495f3c3f1ddb81a46e0e1.jpg" style="margin: 0; width: 100%;" alt="" />
<p style="font-size: 12px; margin: 0;">PikWizard</p>
</a>
</span>
</span>
Free (free of charge)
Free for personal and commercial use.
Author: Creative Art
Similar Free Stock Images

Premium


Premium


Premium


Premium


Premium


Premium


Premium


Premium


Premium


Premium


Premium


Premium


Premium


Premium


Premium


Premium


Premium


Premium


Premium


Premium


Premium


Premium


Premium


Premium