- Home >
- Stock Photos >
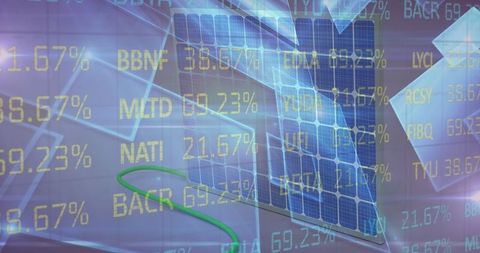
- Animated Financial Bar Chart with Growth and Decline Arrows
Animated Financial Bar Chart with Growth and Decline Arrows Image

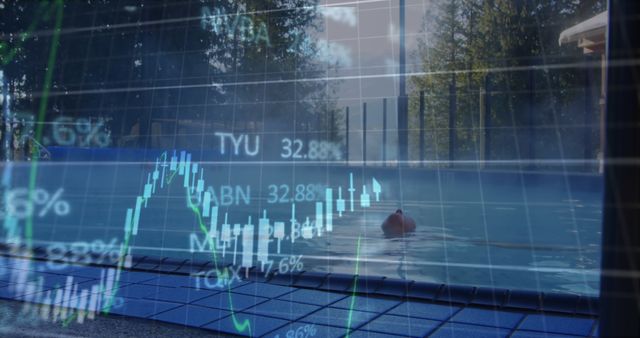
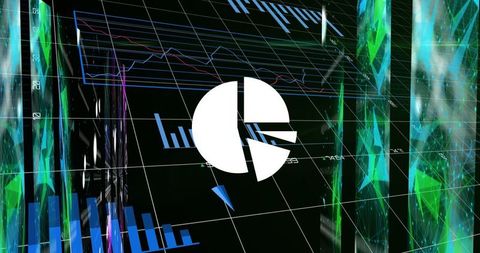
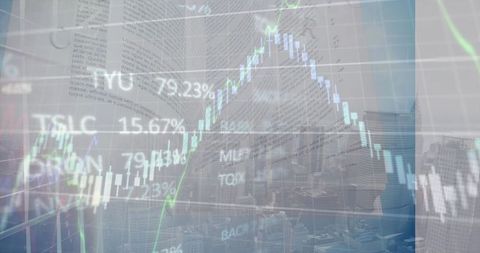
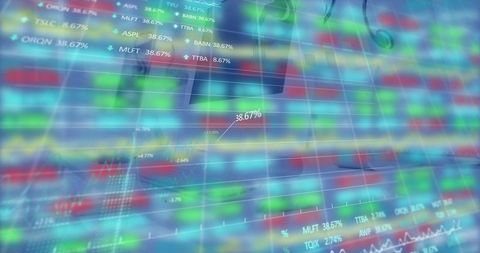
Colorful bars are placed on a digital grid representing stock performance, while green upwards arrows and red downwards trends indicate growth and fall. Ticker values overlay signify lively market action. Useful for articles, videos, and presentations on finance, investments, market analysis, technology’s role in modern finance.
Powered by  - Get 15% off with code: PIKWIZARD15


2
downloads
downloads
Tags:
More
Credit Photo
If you would like to credit the Photo, here are some ways you can do so
Text Link
photo Link
<span class="text-link">
<span>
<a target="_blank" href=https://pikwizard.com/photo/animated-financial-bar-chart-with-growth-and-decline-arrows/511583947238740829885c75bbcc4857/>PikWizard</a>
</span>
</span>
<span class="image-link">
<span
style="margin: 0 0 20px 0; display: inline-block; vertical-align: middle; width: 100%;"
>
<a
target="_blank"
href="https://pikwizard.com/photo/animated-financial-bar-chart-with-growth-and-decline-arrows/511583947238740829885c75bbcc4857/"
style="text-decoration: none; font-size: 10px; margin: 0;"
>
<img src="https://pikwizard.com/pw/medium/511583947238740829885c75bbcc4857.jpg" style="margin: 0; width: 100%;" alt="" />
<p style="font-size: 12px; margin: 0;">PikWizard</p>
</a>
</span>
</span>
Free (free of charge)
Free for personal and commercial use.
Author: Creative Art
Similar Free Stock Images

Premium


Premium


Premium


Premium


Premium


Premium


Premium


Premium


Premium


Premium


Premium


Premium


Premium


Premium


Premium


Premium


Premium


Premium


Premium


Premium


Premium


Premium


Premium


Premium


Premium