- Home >
- Stock Photos >
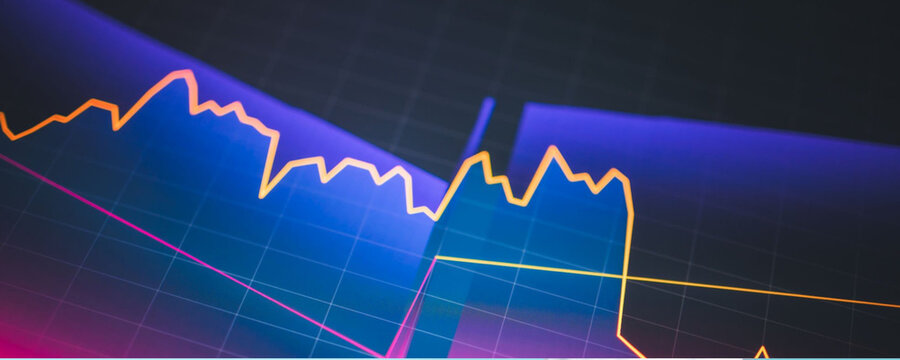
- Animated Financial Chart Depicting Stock Market Trends
Animated Financial Chart Depicting Stock Market Trends Image

Depicts an abstract representation of financial data with a focus on stock market trends and analysis. Suitable for materials related to global economy insights, business investment resources, and financial technology innovations. Can be used for educational content, business presentations, and economic forecasting discussions.
Powered by 


2
downloads
downloads
Tags:
More
Credit Photo
If you would like to credit the Photo, here are some ways you can do so
Text Link
photo Link
<span class="text-link">
<span>
<a target="_blank" href=https://pikwizard.com/photo/animated-financial-chart-depicting-stock-market-trends/22ab85cde37e8c069600b8d20fb482ae/>PikWizard</a>
</span>
</span>
<span class="image-link">
<span
style="margin: 0 0 20px 0; display: inline-block; vertical-align: middle; width: 100%;"
>
<a
target="_blank"
href="https://pikwizard.com/photo/animated-financial-chart-depicting-stock-market-trends/22ab85cde37e8c069600b8d20fb482ae/"
style="text-decoration: none; font-size: 10px; margin: 0;"
>
<img src="https://pikwizard.com/pw/medium/22ab85cde37e8c069600b8d20fb482ae.jpg" style="margin: 0; width: 100%;" alt="" />
<p style="font-size: 12px; margin: 0;">PikWizard</p>
</a>
</span>
</span>
Free (free of charge)
Free for personal and commercial use.
Author: Awesome Content
Similar Free Stock Images

Premium


Premium


Premium


Premium


Premium


Premium


Premium


Premium


Premium


Premium


Premium


Premium


Premium


Premium


Premium


Premium


Premium


Premium


Premium


Premium


Premium


Premium


Premium


Premium