- Home >
- Stock Photos >
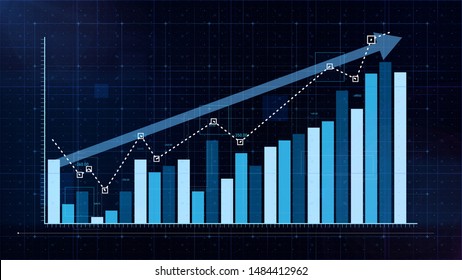
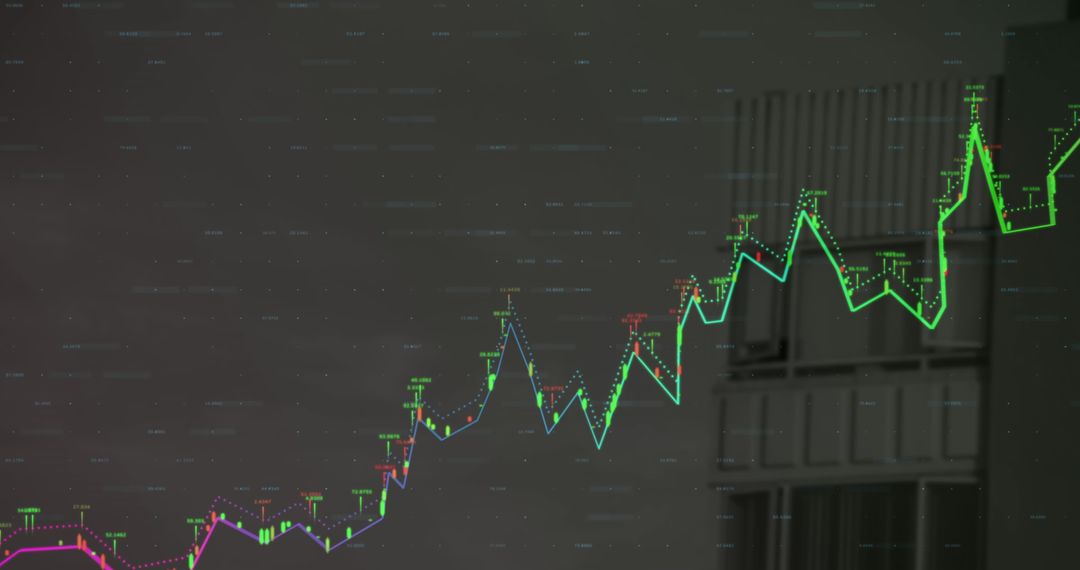
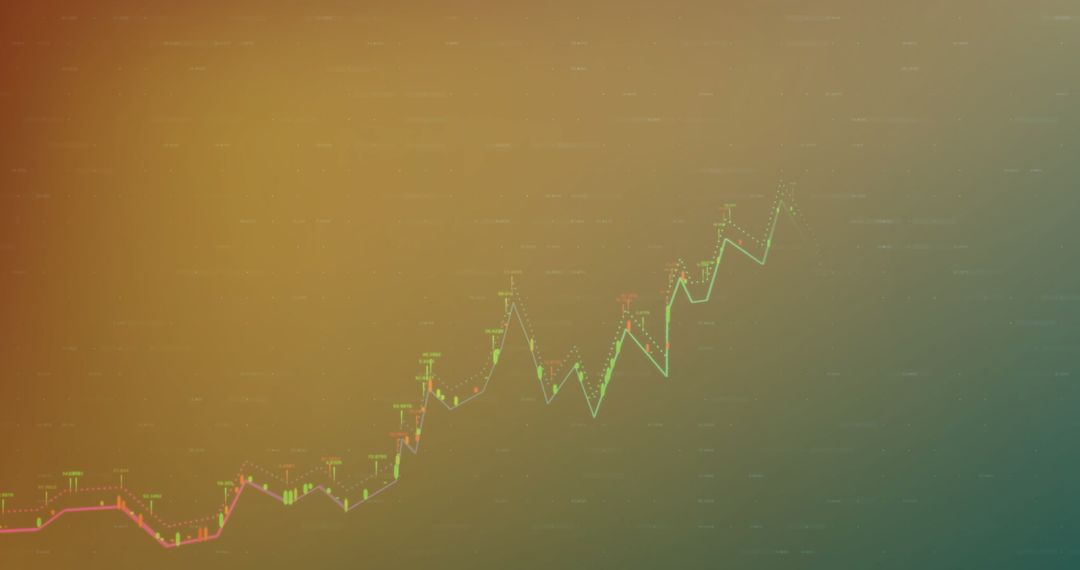
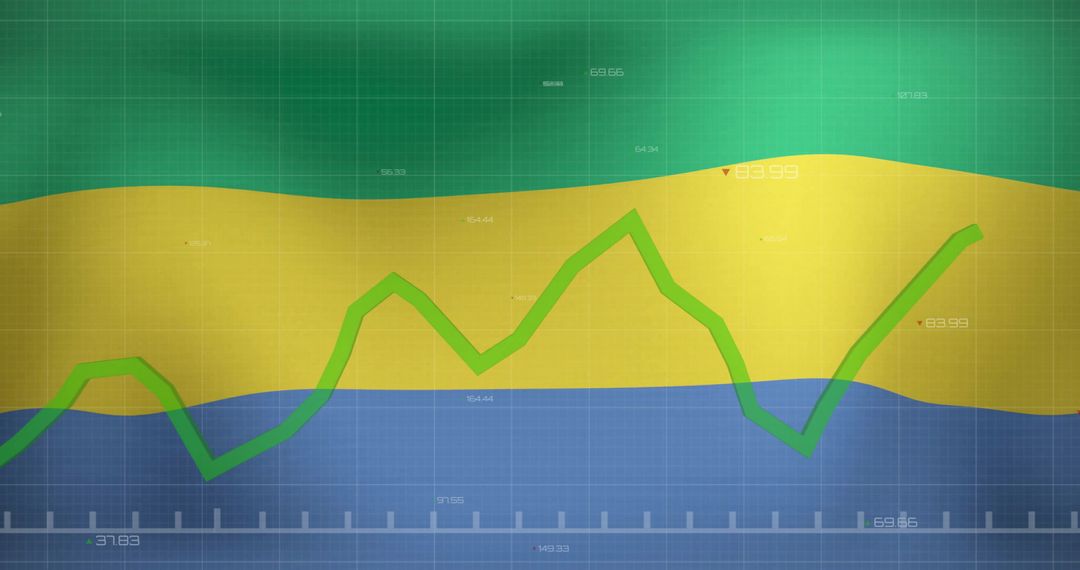
- Ascending Line Graph on Vivid Green Abstract Financial Background
Ascending Line Graph on Vivid Green Abstract Financial Background Image

Digital image depicting an ascending line graph over a vibrant green gradient background showcases market growth and economic analysis. Useful for demonstrating positive financial trends, data analytics, or stock market forecasting materials. Ideal for presentations conveying investment potential or progress dedication.
Powered by  - Get 15% off with code: PIKWIZARD15


2
downloads
downloads
Tags:
More
Credit Photo
If you would like to credit the Photo, here are some ways you can do so
Text Link
photo Link
<span class="text-link">
<span>
<a target="_blank" href=https://pikwizard.com/photo/ascending-line-graph-on-vivid-green-abstract-financial-background/a6b80a7e4529df181ad672b936d1eca0/>PikWizard</a>
</span>
</span>
<span class="image-link">
<span
style="margin: 0 0 20px 0; display: inline-block; vertical-align: middle; width: 100%;"
>
<a
target="_blank"
href="https://pikwizard.com/photo/ascending-line-graph-on-vivid-green-abstract-financial-background/a6b80a7e4529df181ad672b936d1eca0/"
style="text-decoration: none; font-size: 10px; margin: 0;"
>
<img src="https://pikwizard.com/pw/medium/a6b80a7e4529df181ad672b936d1eca0.jpg" style="margin: 0; width: 100%;" alt="" />
<p style="font-size: 12px; margin: 0;">PikWizard</p>
</a>
</span>
</span>
Free (free of charge)
Free for personal and commercial use.
Author: Authentic Images
Similar Free Stock Images

Premium


Premium


Premium


Premium


Premium


Premium


Premium


Premium


Premium


Premium


Premium


Premium


Premium


Premium


Premium


Premium


Premium


Premium


Premium


Premium


Premium


Premium


Premium


Premium