- Home >
- Stock Photos >
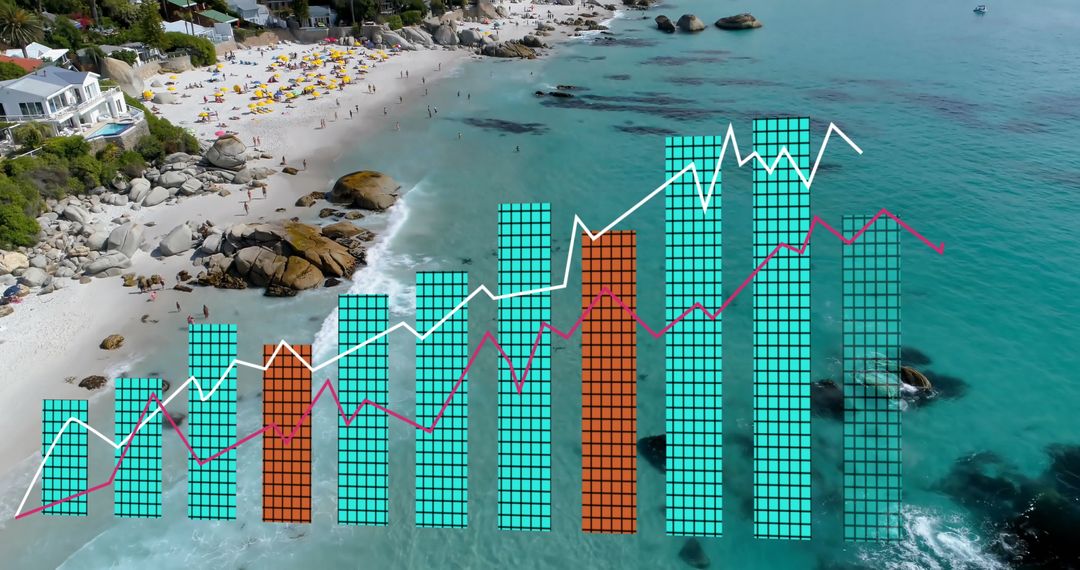
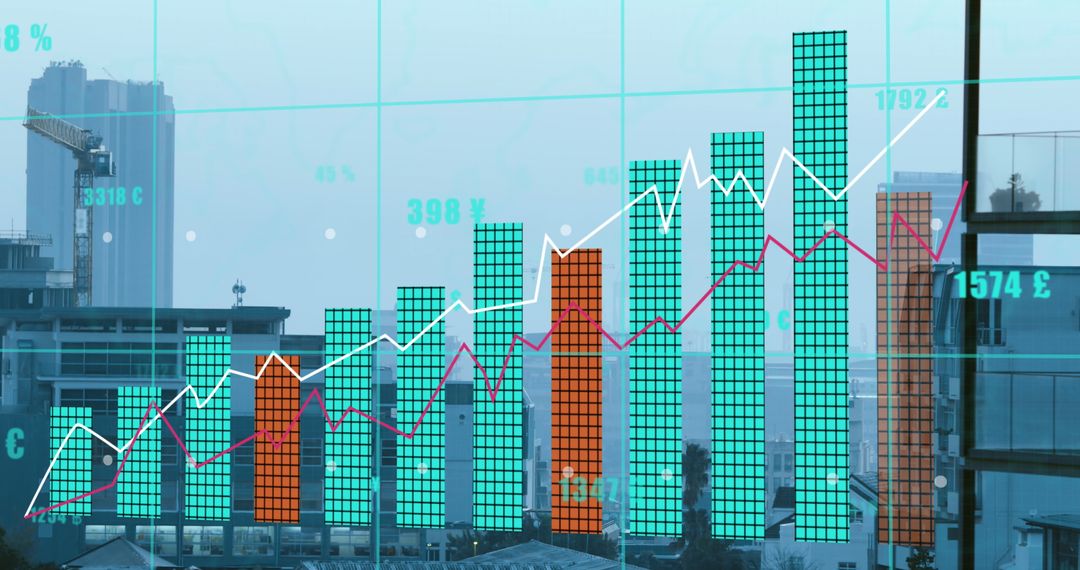
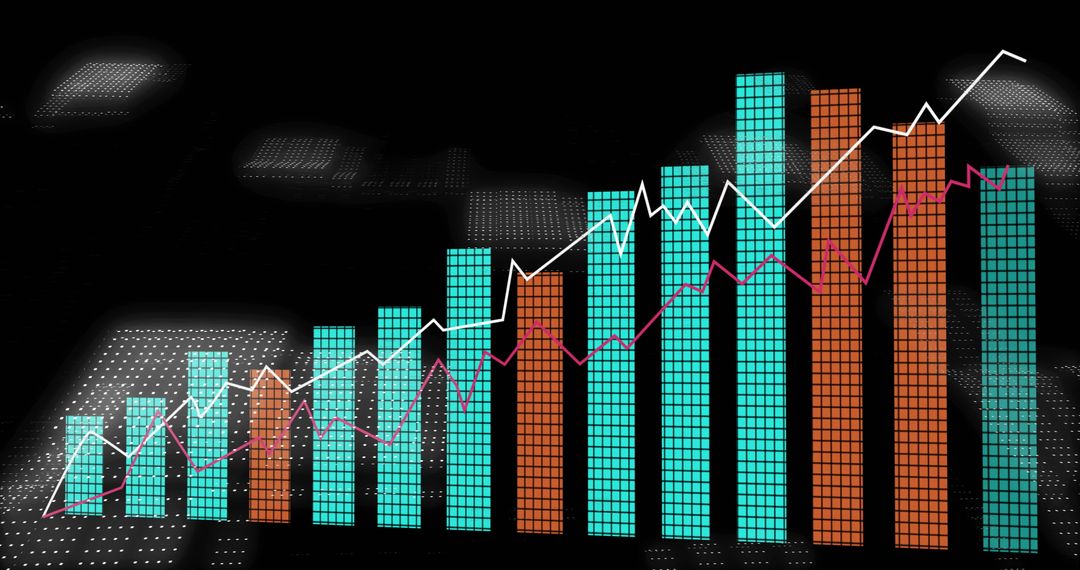
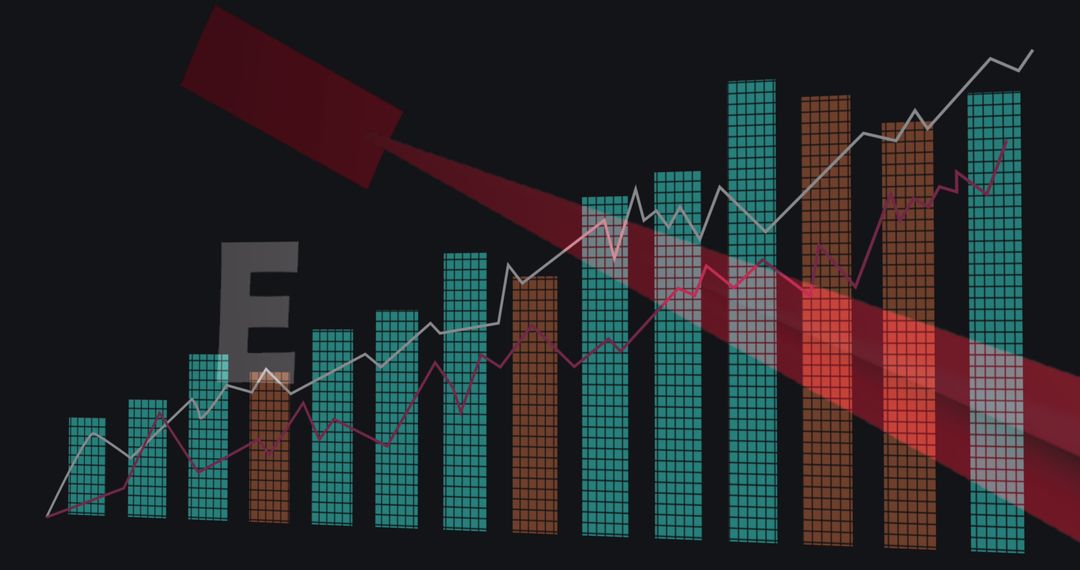
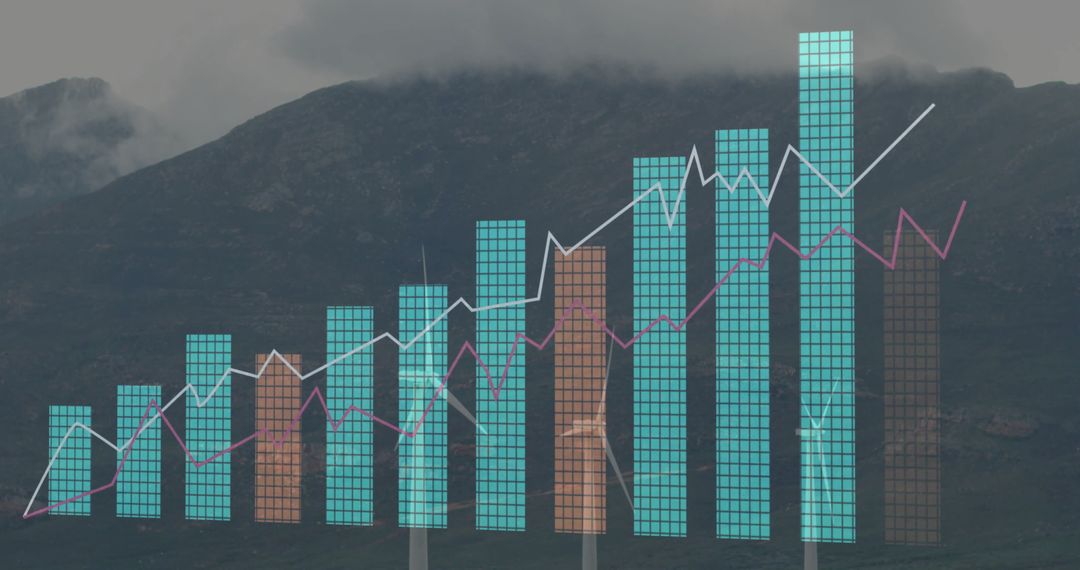
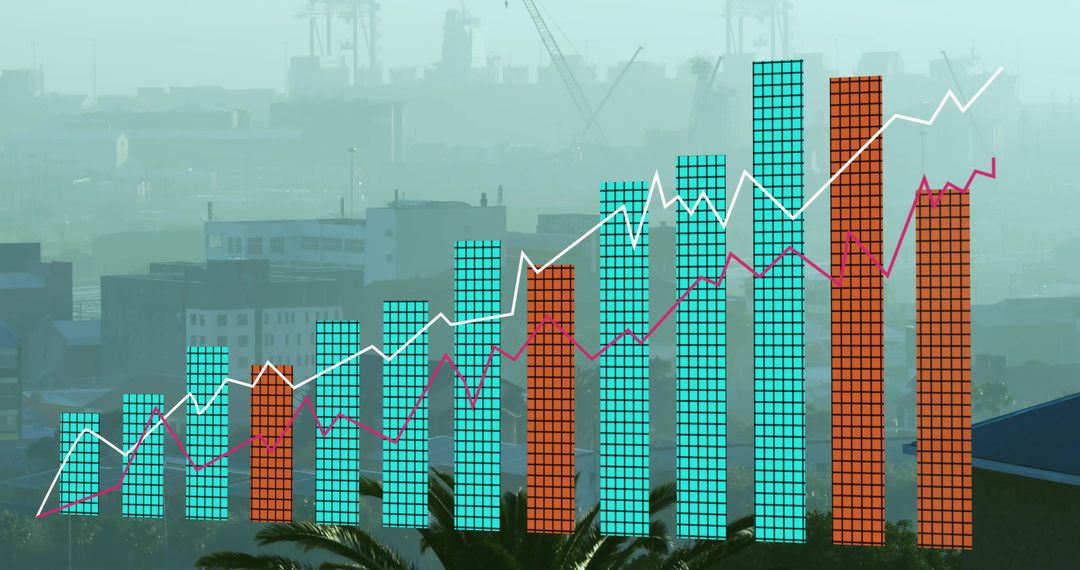
- Bar and Line Chart Displaying Business Growth in Office Lounge
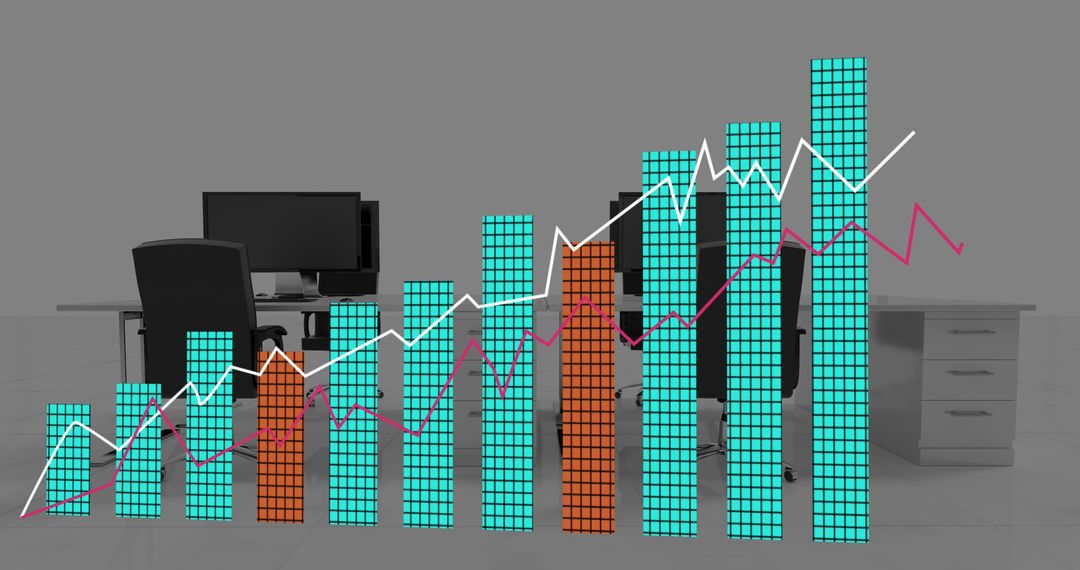
Bar and Line Chart Displaying Business Growth in Office Lounge Image
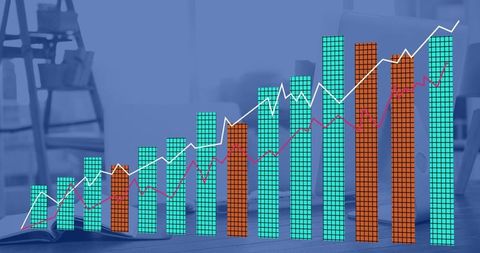
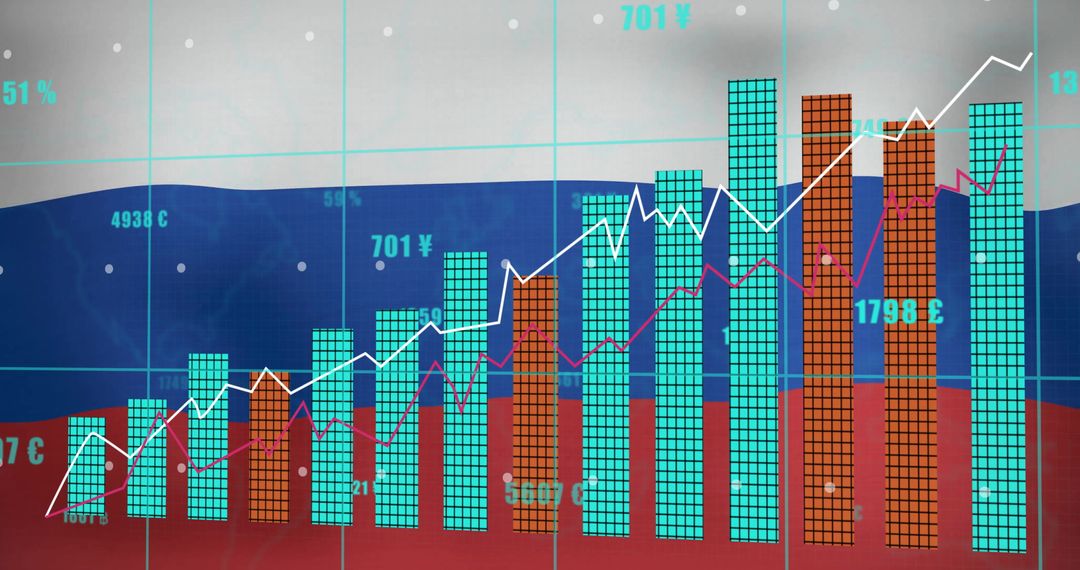
This image shows a digital bar and line chart with a rising trend placed in an office lounge. The contrasting layers reflect business growth and analytical progression, making it an ideal choice for presentations on corporate performance, financial analysis, and strategic planning. Suitable for websites, reports, and marketing material emphasizing workplace productivity and modern analytics.
Powered by 


0
downloads
downloads
Tags:
More
Credit Photo
If you would like to credit the Photo, here are some ways you can do so
Text Link
photo Link
<span class="text-link">
<span>
<a target="_blank" href=https://pikwizard.com/photo/bar-and-line-chart-displaying-business-growth-in-office-lounge/d768ac02baea8a04b463e09ca46c093e/>PikWizard</a>
</span>
</span>
<span class="image-link">
<span
style="margin: 0 0 20px 0; display: inline-block; vertical-align: middle; width: 100%;"
>
<a
target="_blank"
href="https://pikwizard.com/photo/bar-and-line-chart-displaying-business-growth-in-office-lounge/d768ac02baea8a04b463e09ca46c093e/"
style="text-decoration: none; font-size: 10px; margin: 0;"
>
<img src="https://pikwizard.com/pw/medium/d768ac02baea8a04b463e09ca46c093e.jpg" style="margin: 0; width: 100%;" alt="" />
<p style="font-size: 12px; margin: 0;">PikWizard</p>
</a>
</span>
</span>
Free (free of charge)
Free for personal and commercial use.
Author: Awesome Content
Similar Free Stock Images
Premium


Premium


Premium


Premium


Premium


Premium


Premium


Premium


Premium


Premium


Premium


Premium


Premium


Premium


Premium


Premium


Premium


Premium


Premium


Premium


Premium


Premium


Premium


Premium