- Home >
- Stock Photos >
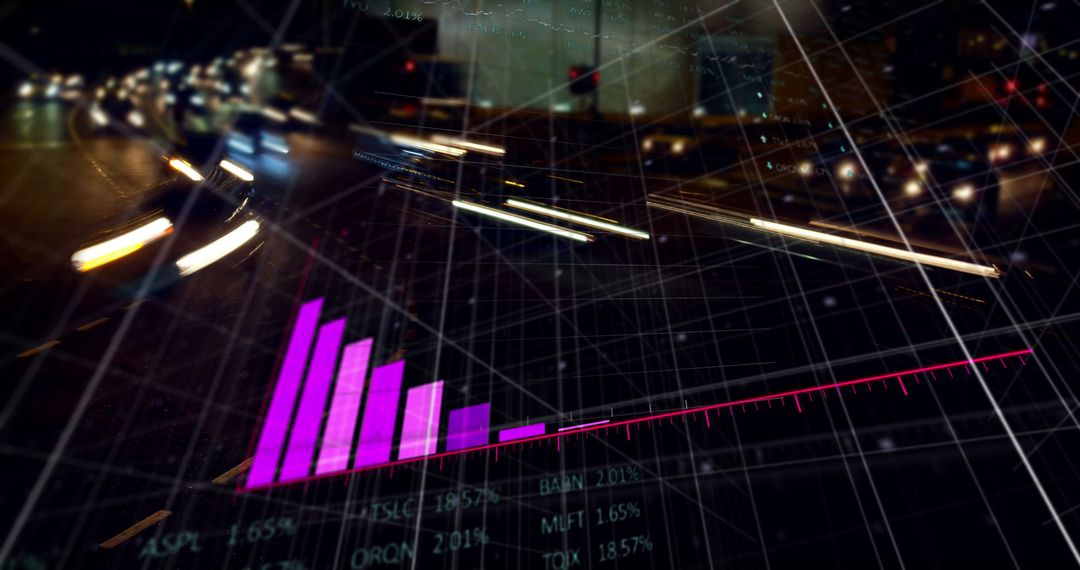
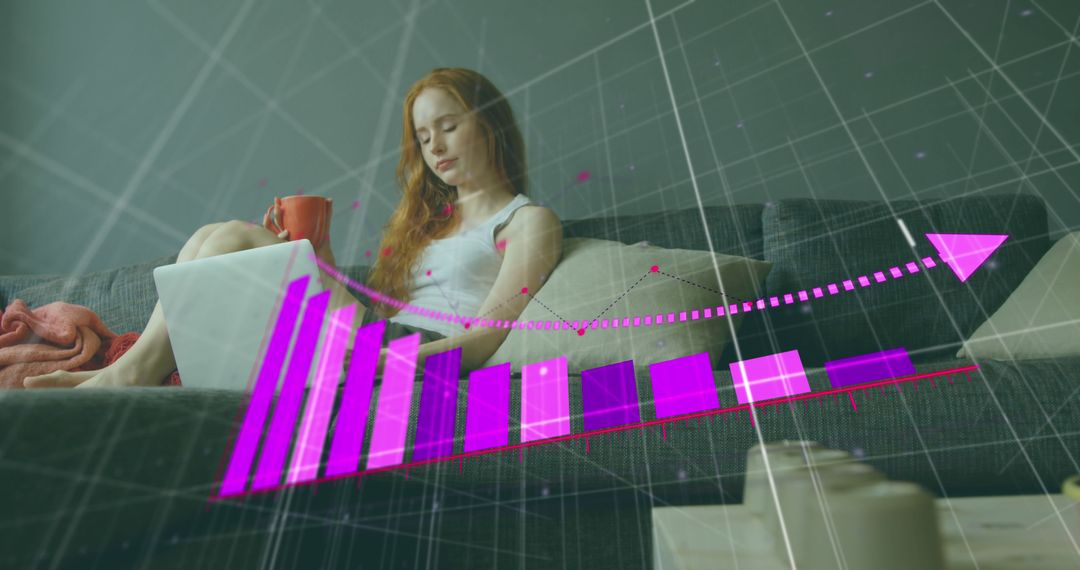
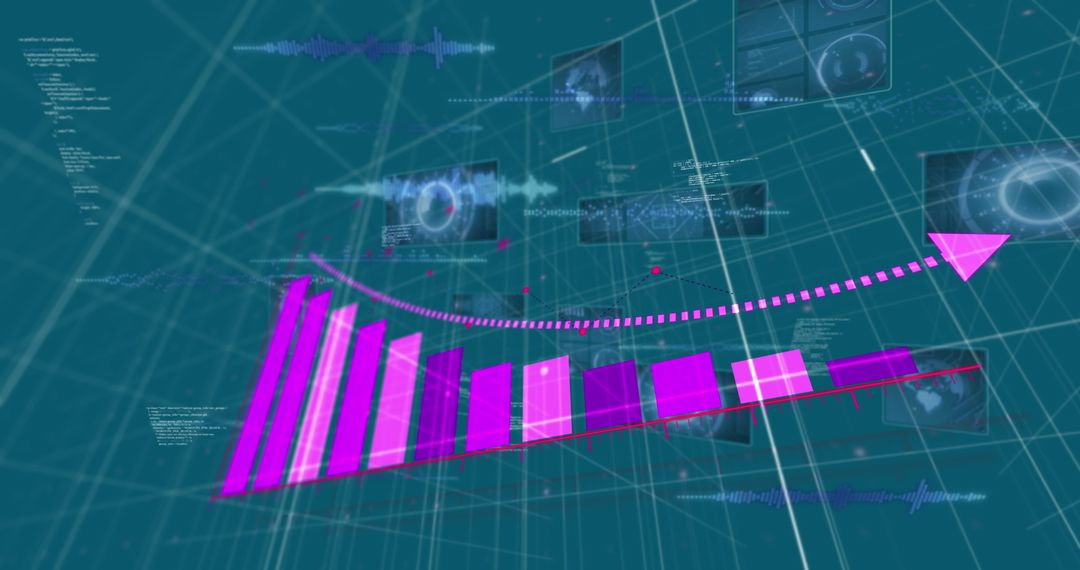
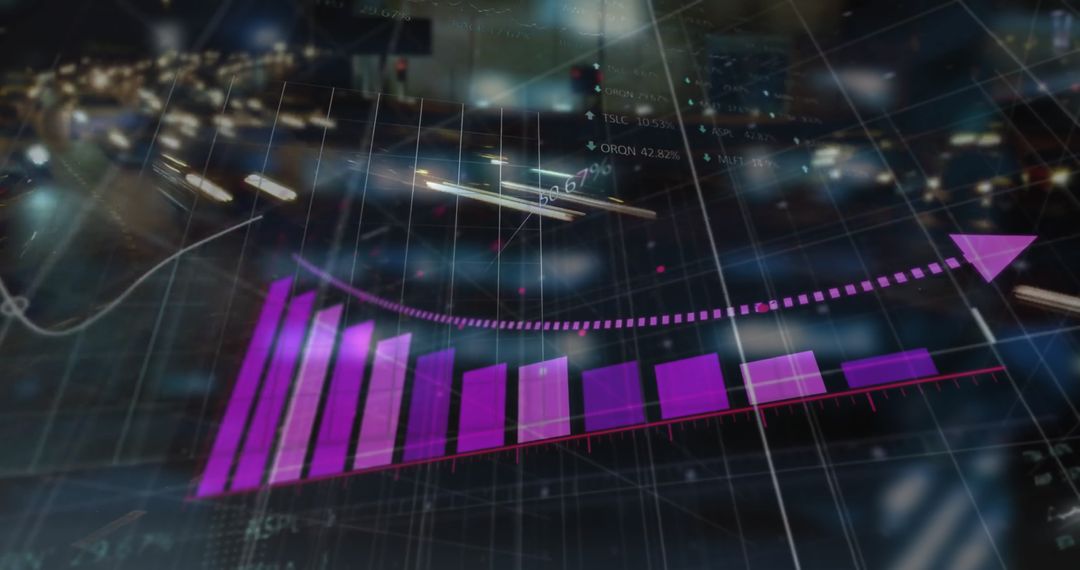
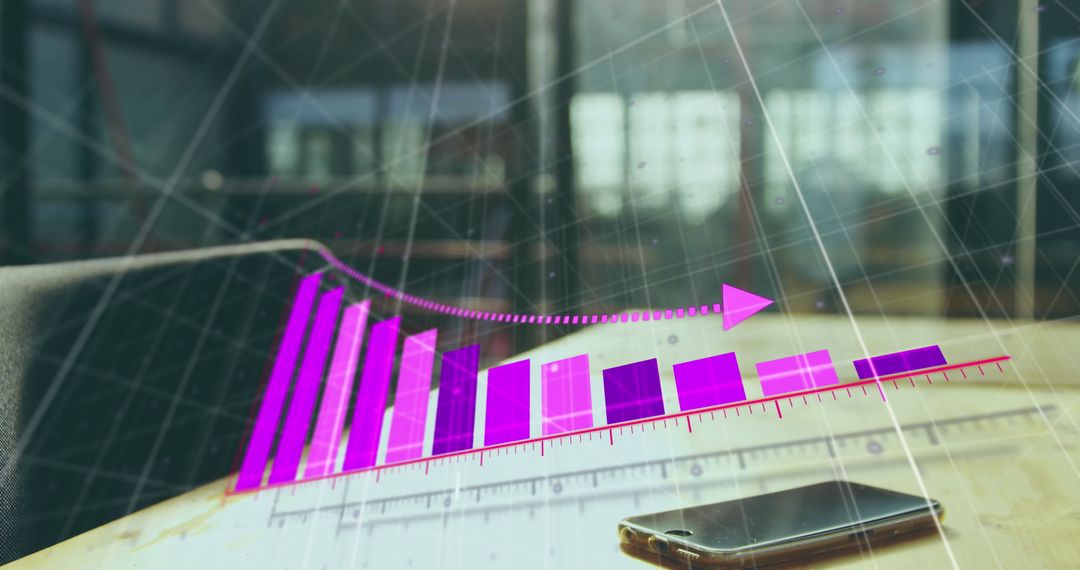
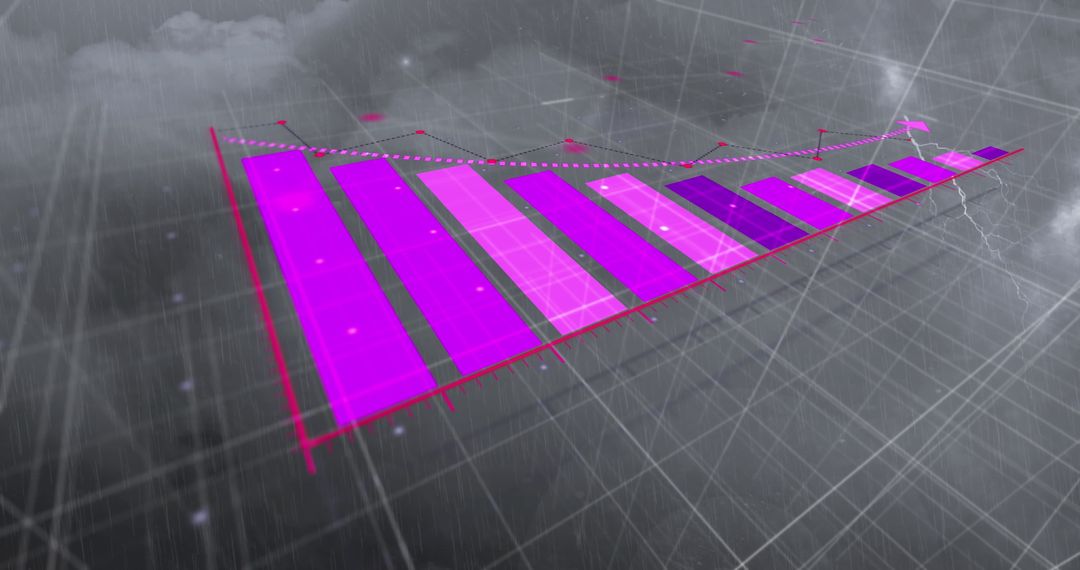
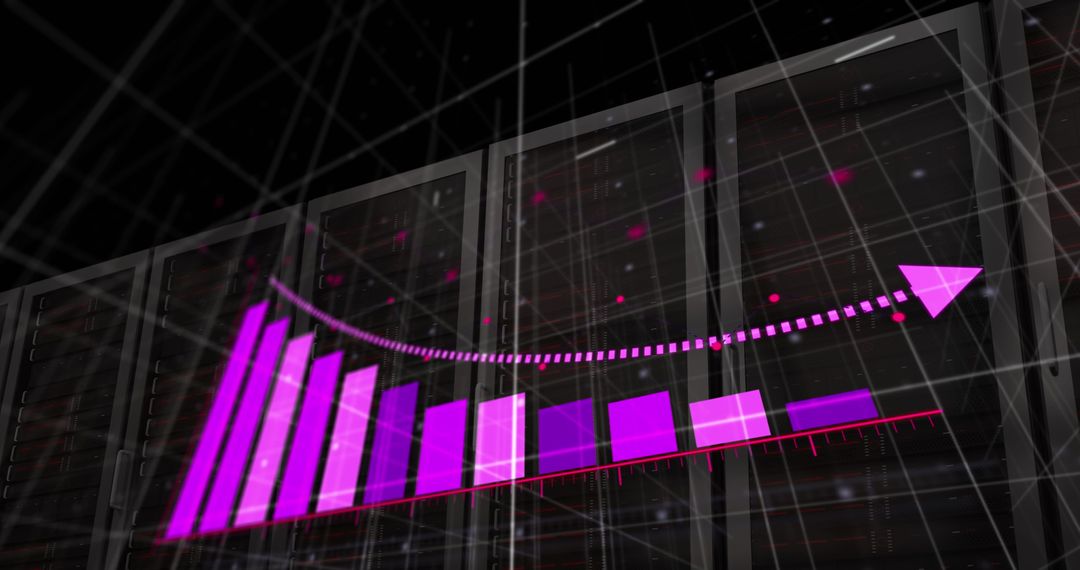
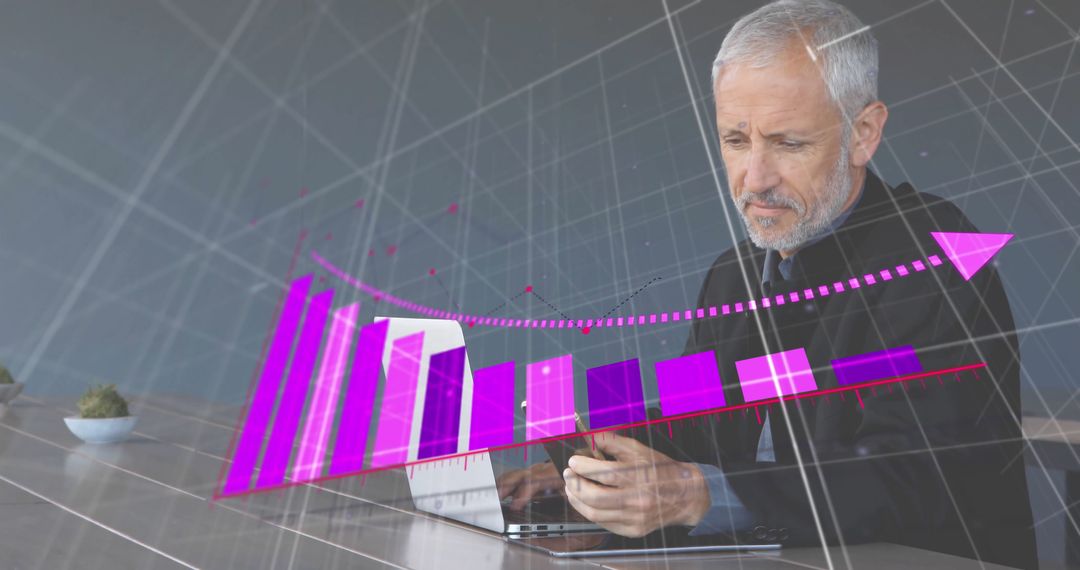
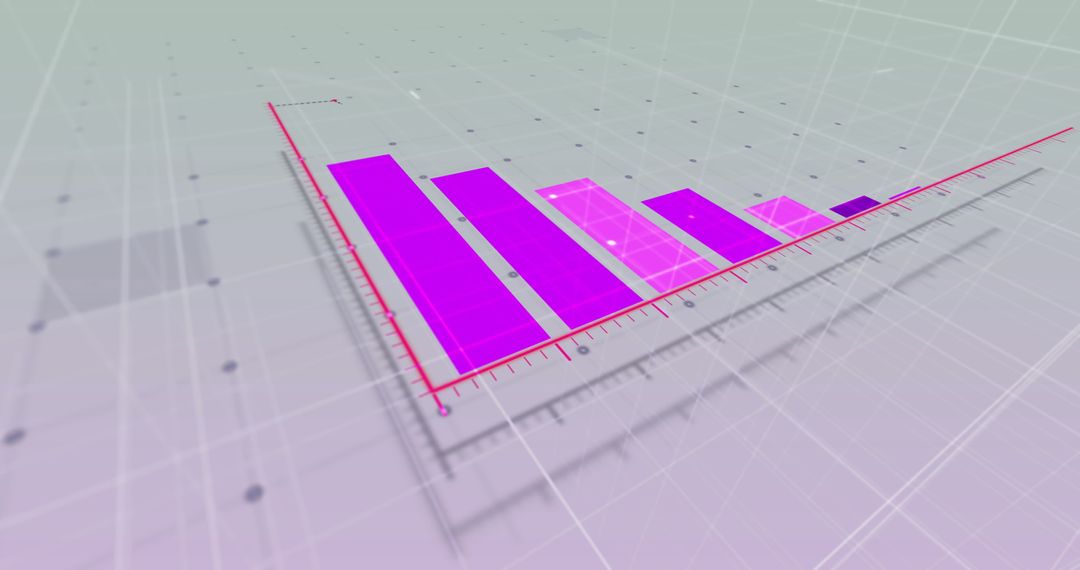
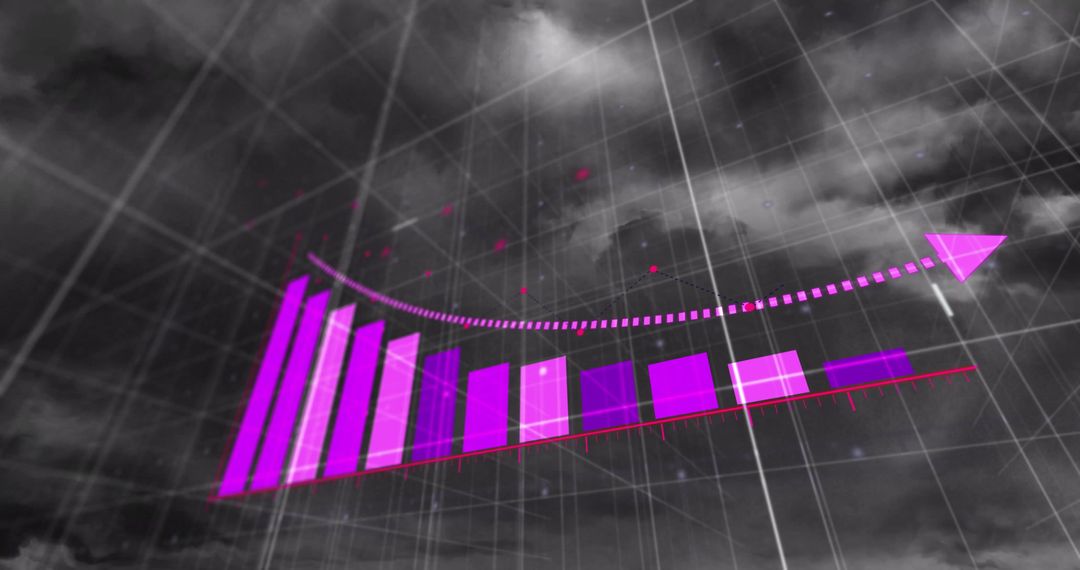
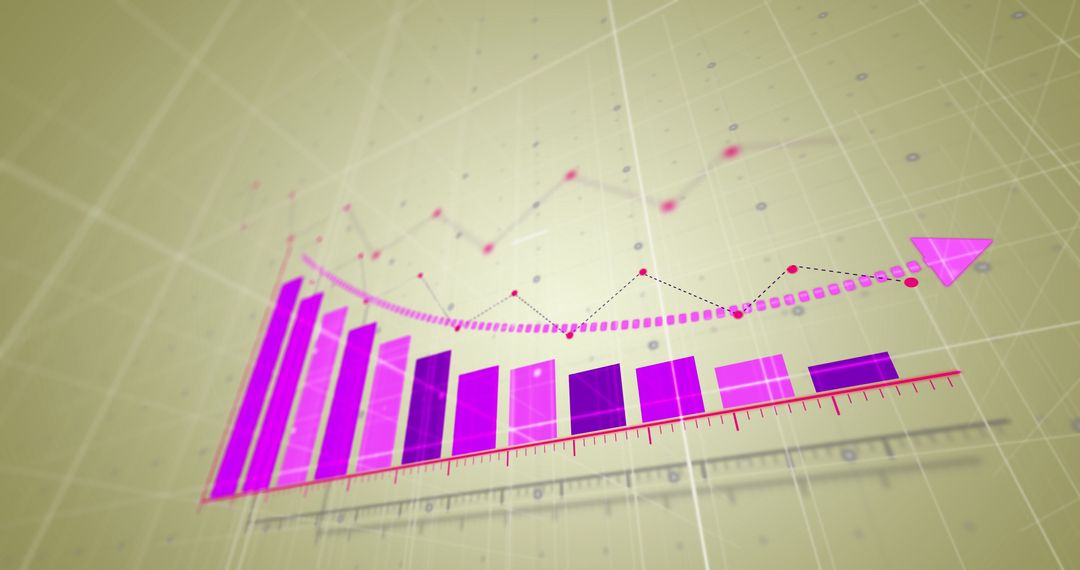
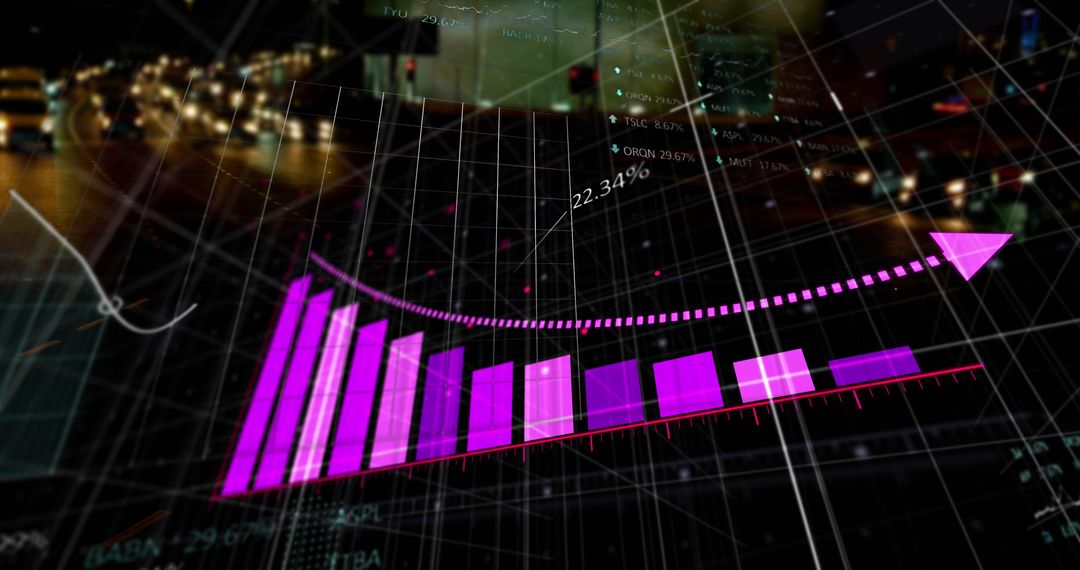
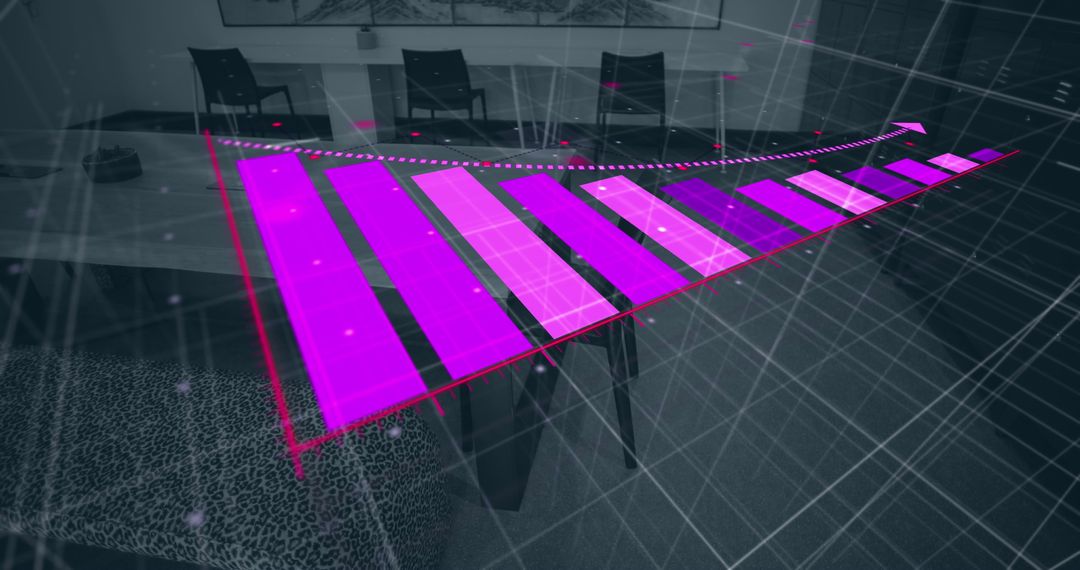
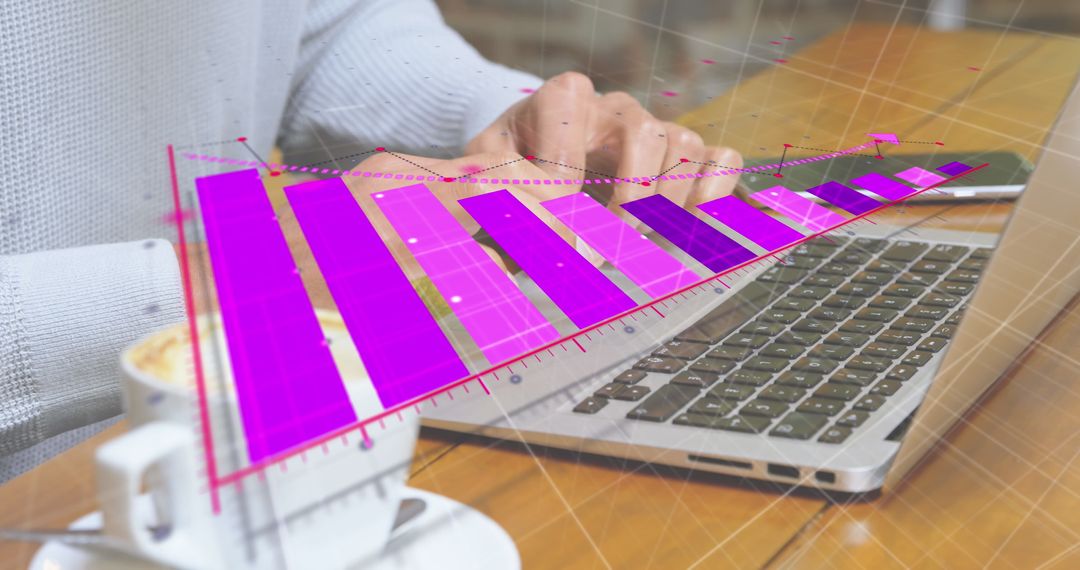
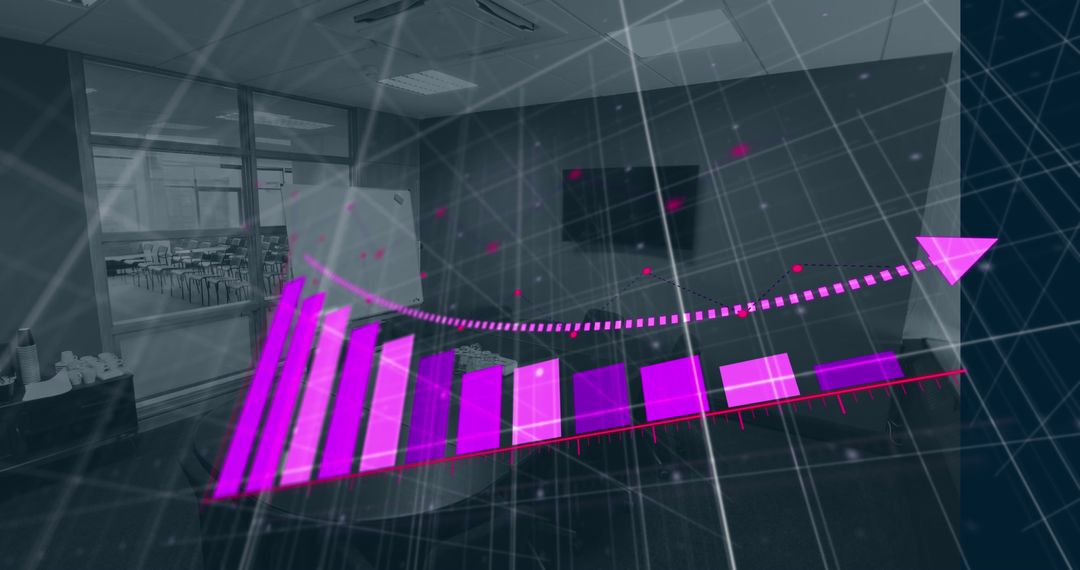
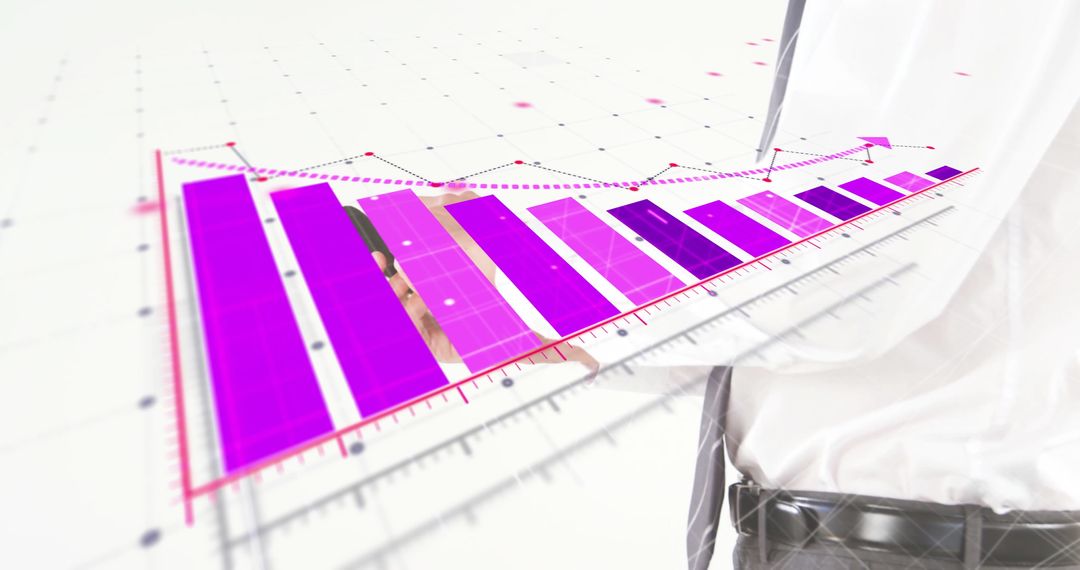
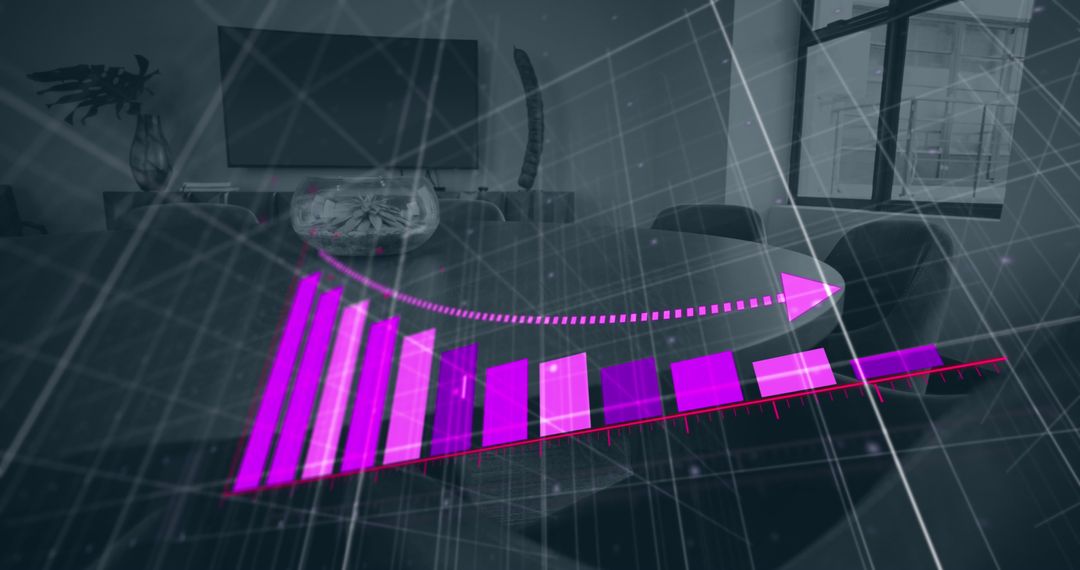
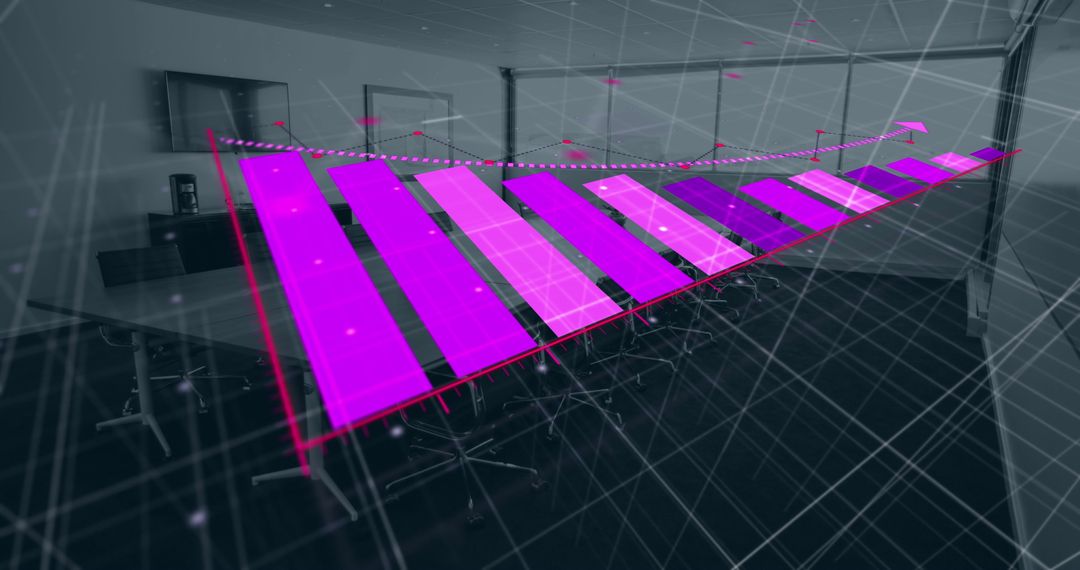
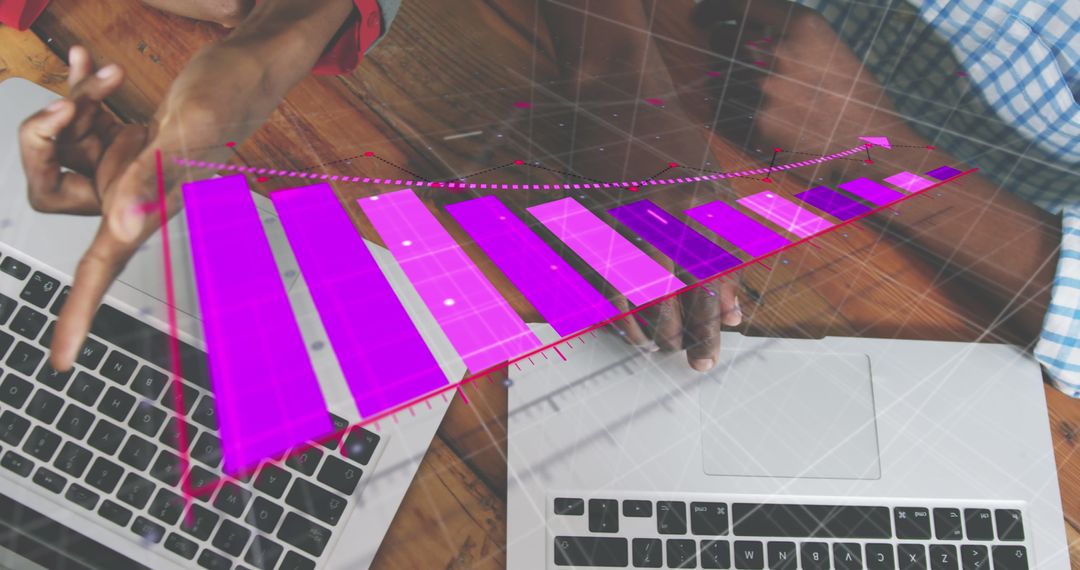
- Bar Graph Projection Showing Financial Loss Over Empty Office Furniture
Bar Graph Projection Showing Financial Loss Over Empty Office Furniture Image
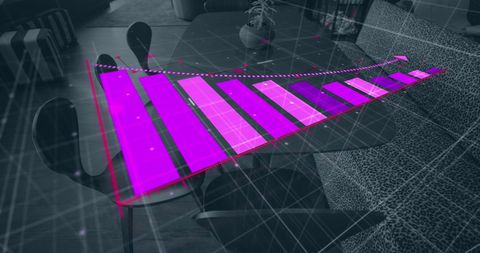
Image features multiple exposure of a digital bar graph depicting loss across empty office chairs and a sofa, symbolizing economic challenges such as recession and inflation impacting business environments. Useful for business reports, financial articles, or discussions around economic crises and office downsizing impacts.
Powered by  - Get 15% off with code: PIKWIZARD15


2
downloads
downloads
Tags:
More
Credit Photo
If you would like to credit the Photo, here are some ways you can do so
Text Link
photo Link
<span class="text-link">
<span>
<a target="_blank" href=https://pikwizard.com/photo/bar-graph-projection-showing-financial-loss-over-empty-office-furniture/e79bc1ff1d763f6aab05c4f44a069695/>PikWizard</a>
</span>
</span>
<span class="image-link">
<span
style="margin: 0 0 20px 0; display: inline-block; vertical-align: middle; width: 100%;"
>
<a
target="_blank"
href="https://pikwizard.com/photo/bar-graph-projection-showing-financial-loss-over-empty-office-furniture/e79bc1ff1d763f6aab05c4f44a069695/"
style="text-decoration: none; font-size: 10px; margin: 0;"
>
<img src="https://pikwizard.com/pw/medium/e79bc1ff1d763f6aab05c4f44a069695.jpg" style="margin: 0; width: 100%;" alt="" />
<p style="font-size: 12px; margin: 0;">PikWizard</p>
</a>
</span>
</span>
Free (free of charge)
Free for personal and commercial use.
Author: Creative Art
Similar Free Stock Images