- Home >
- Stock Photos >
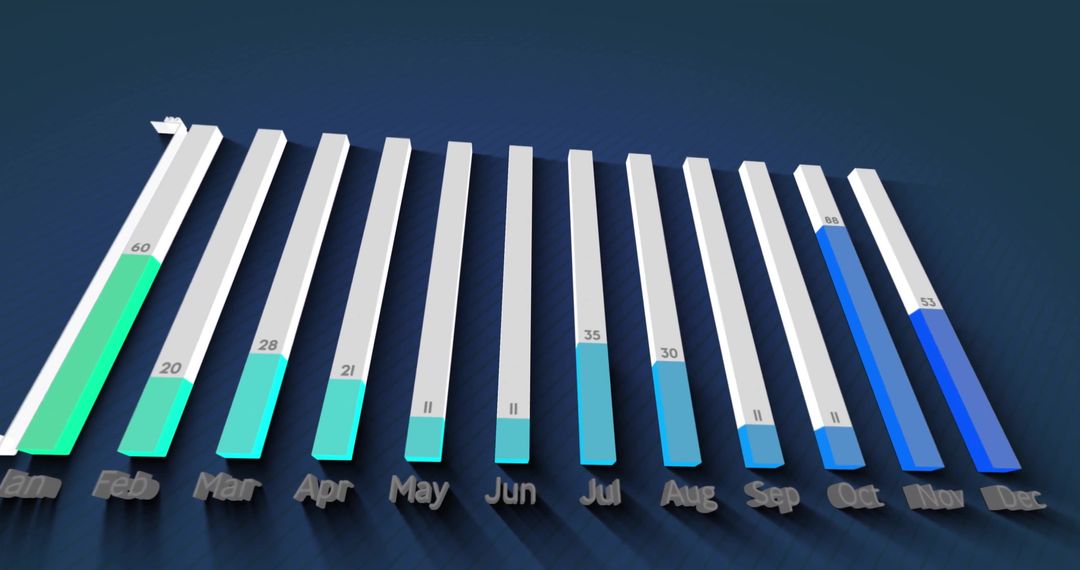
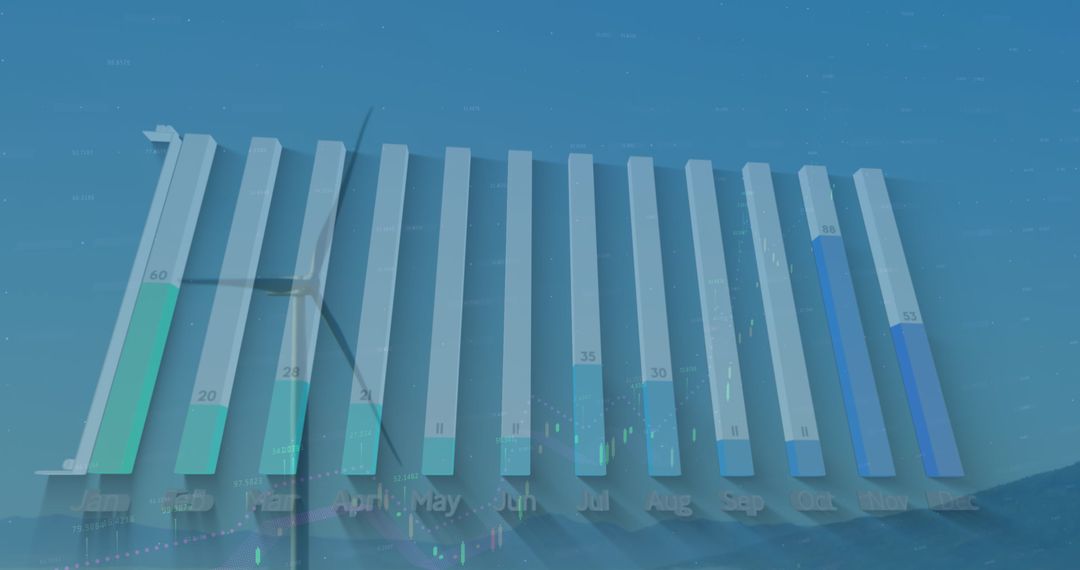
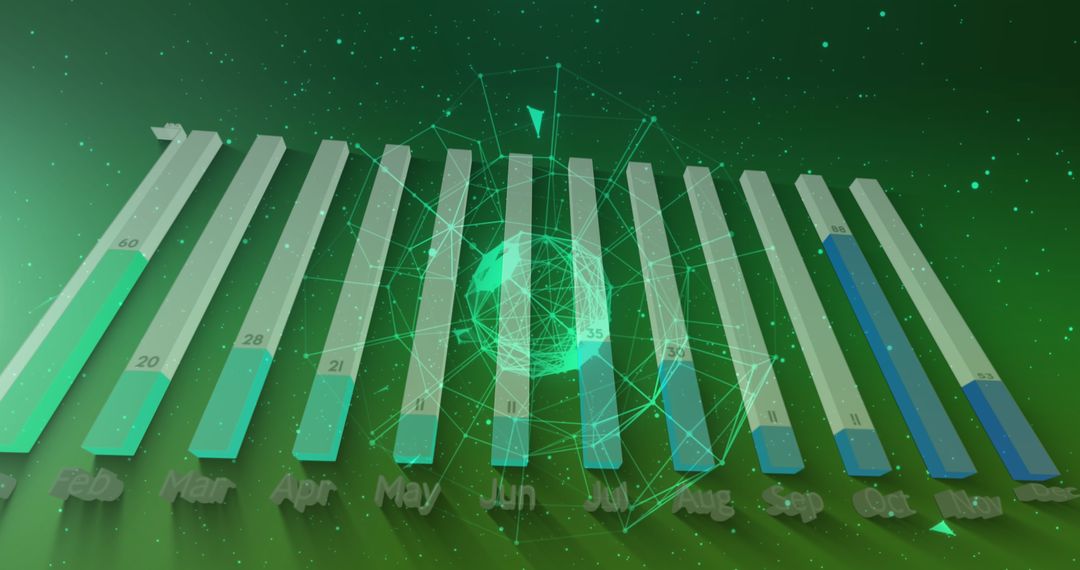
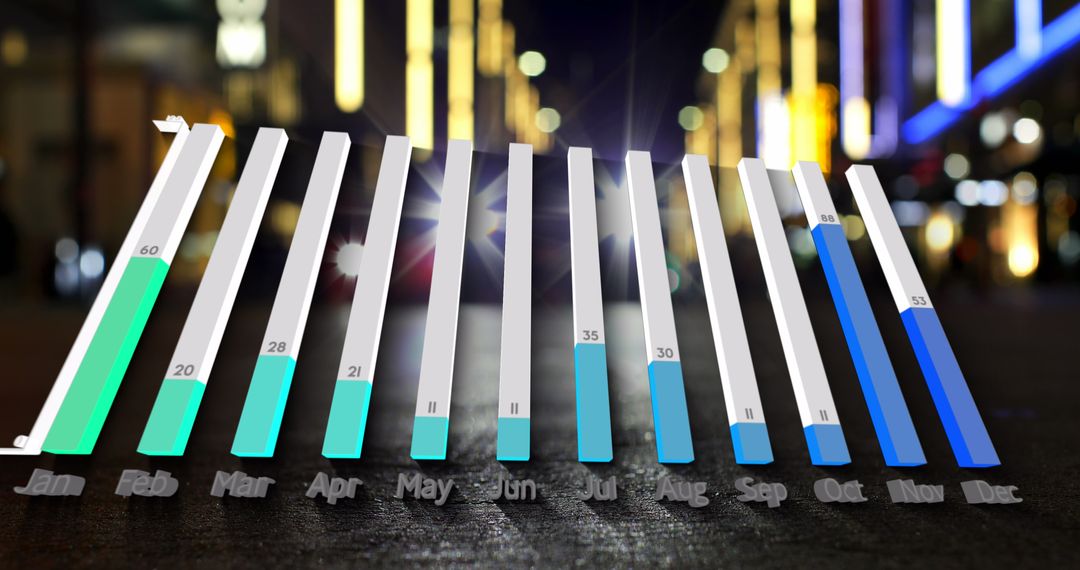
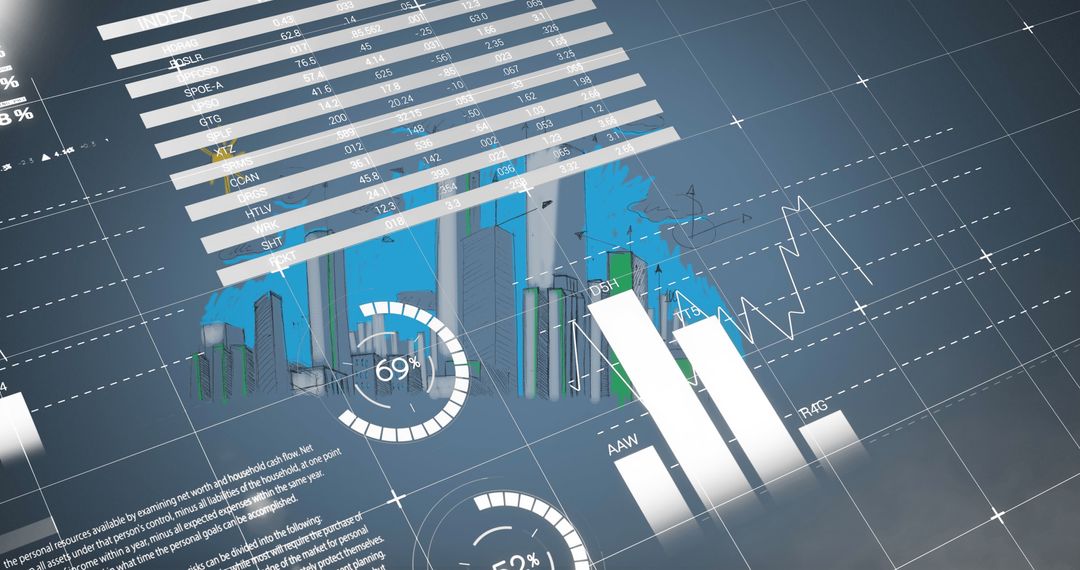
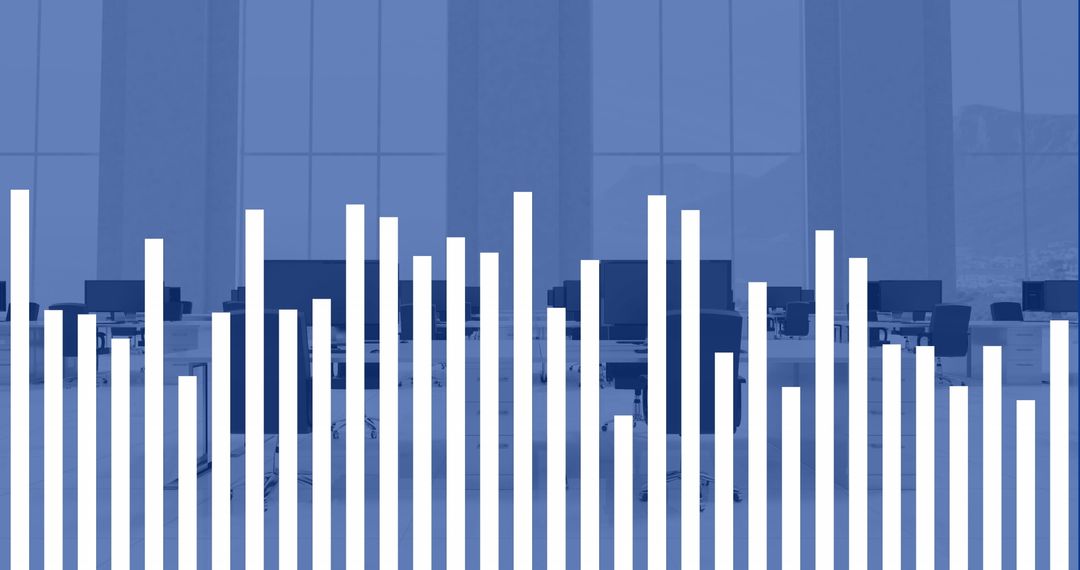
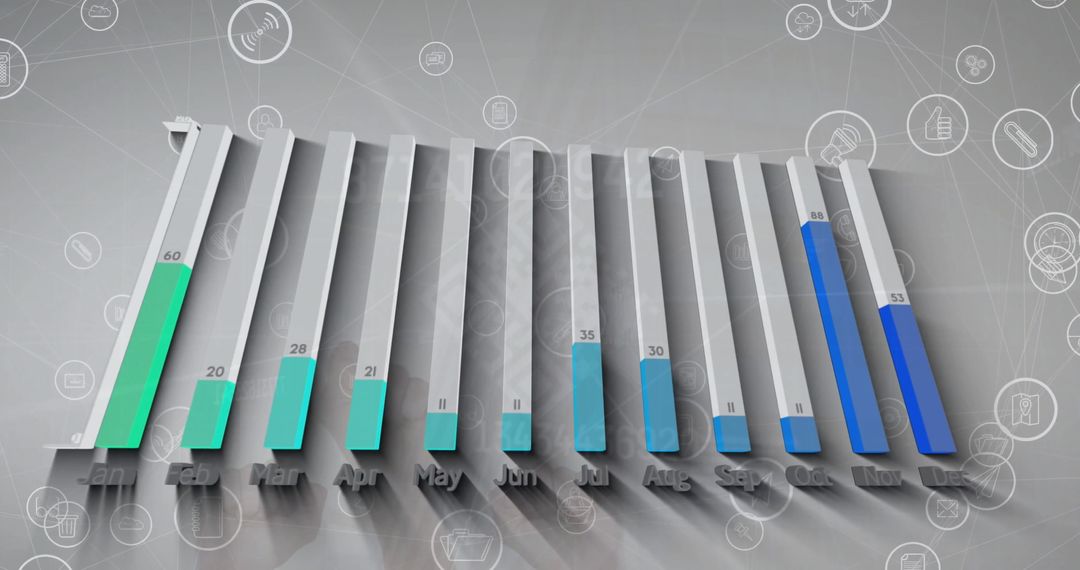
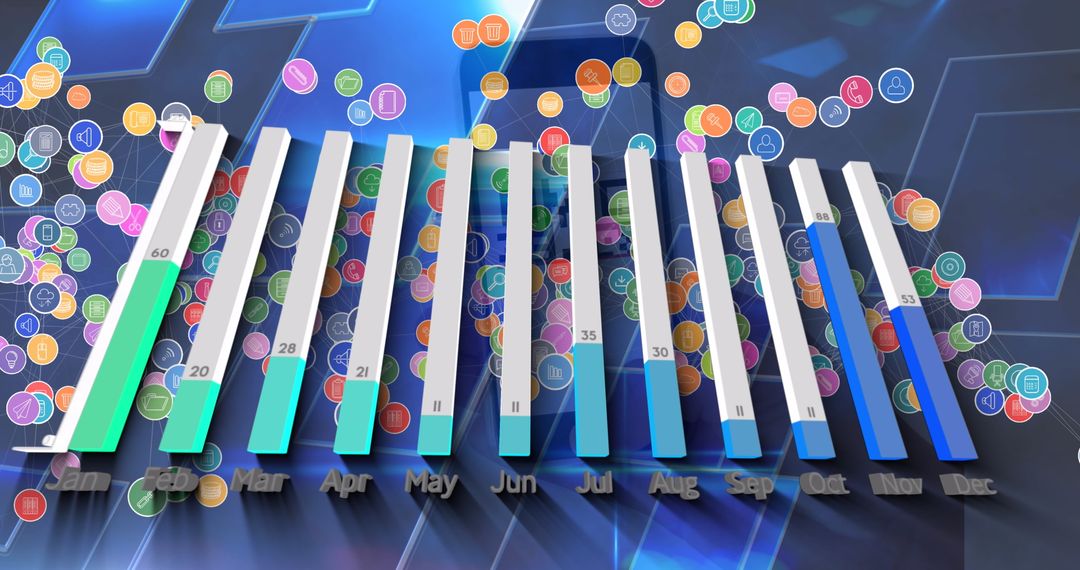
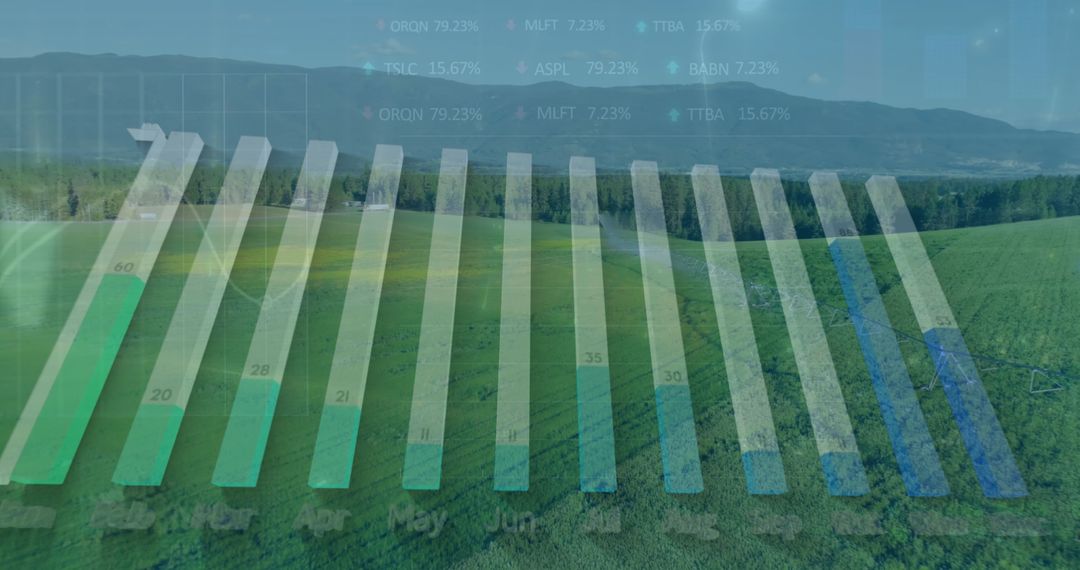
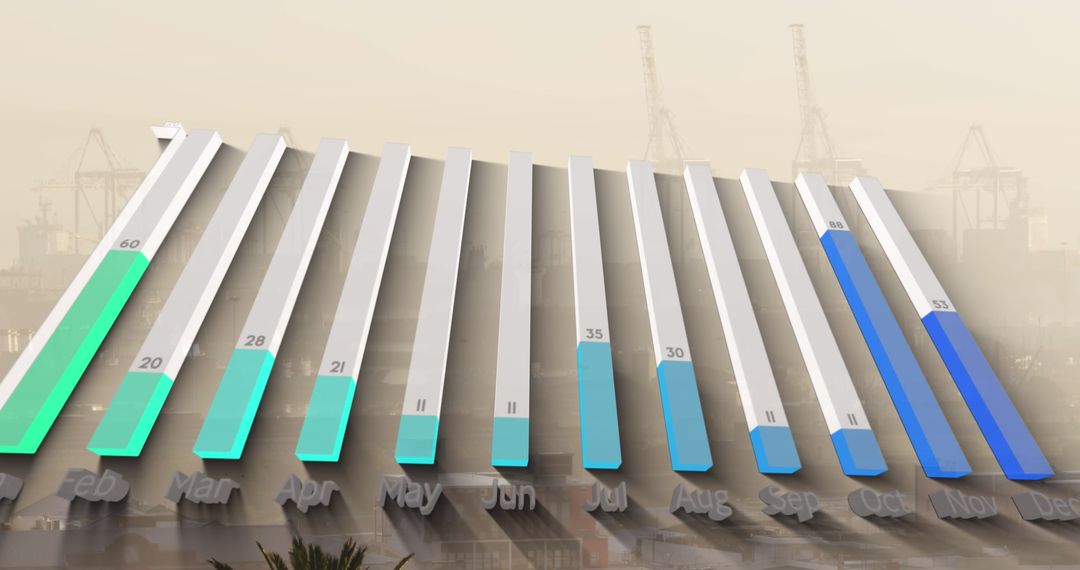
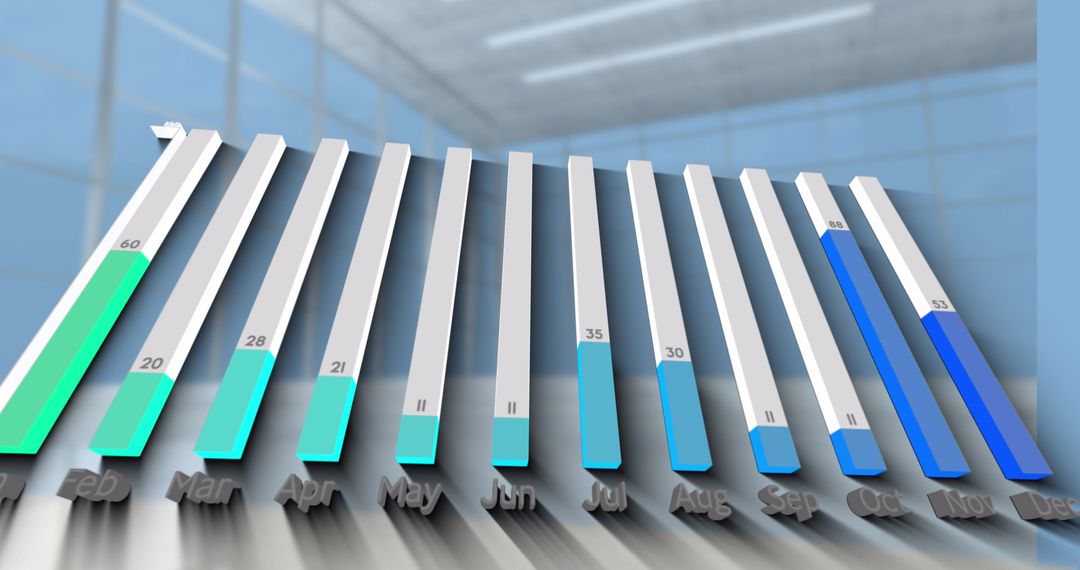
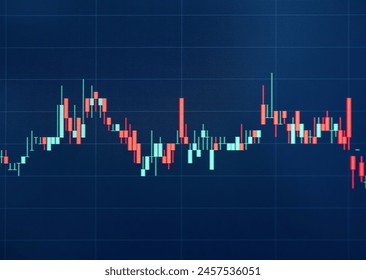
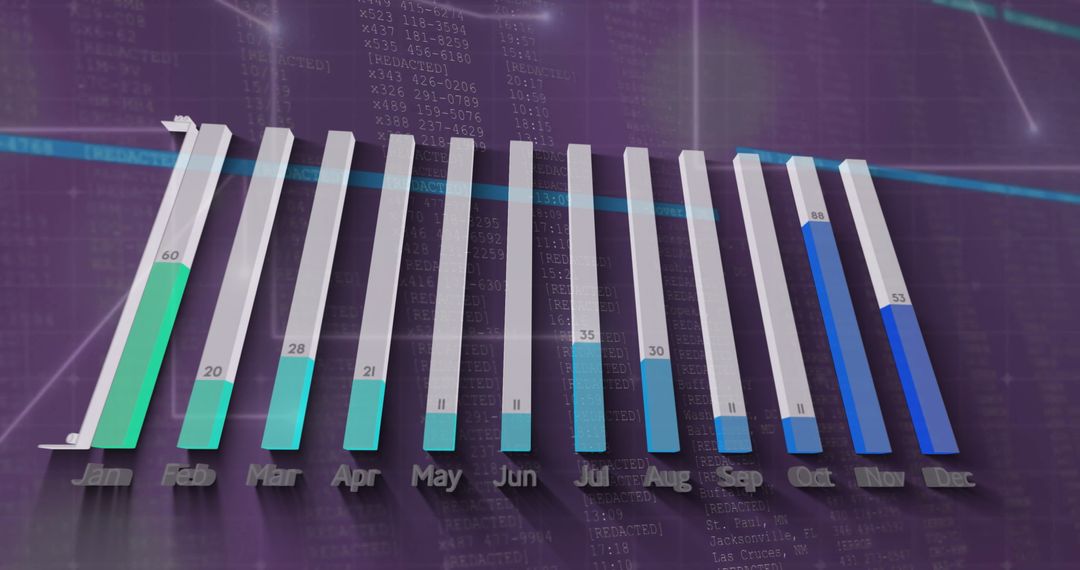
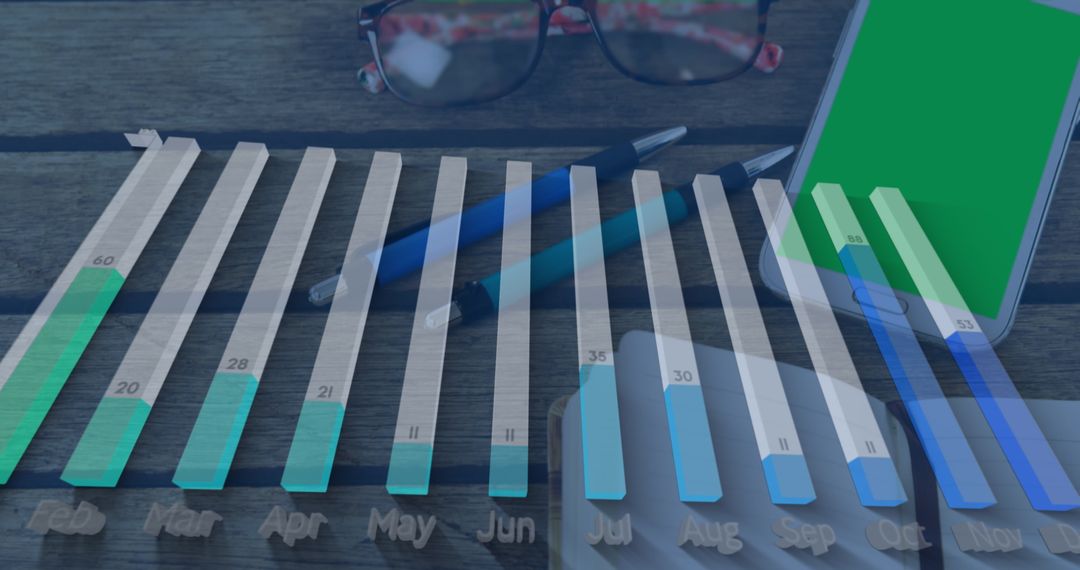
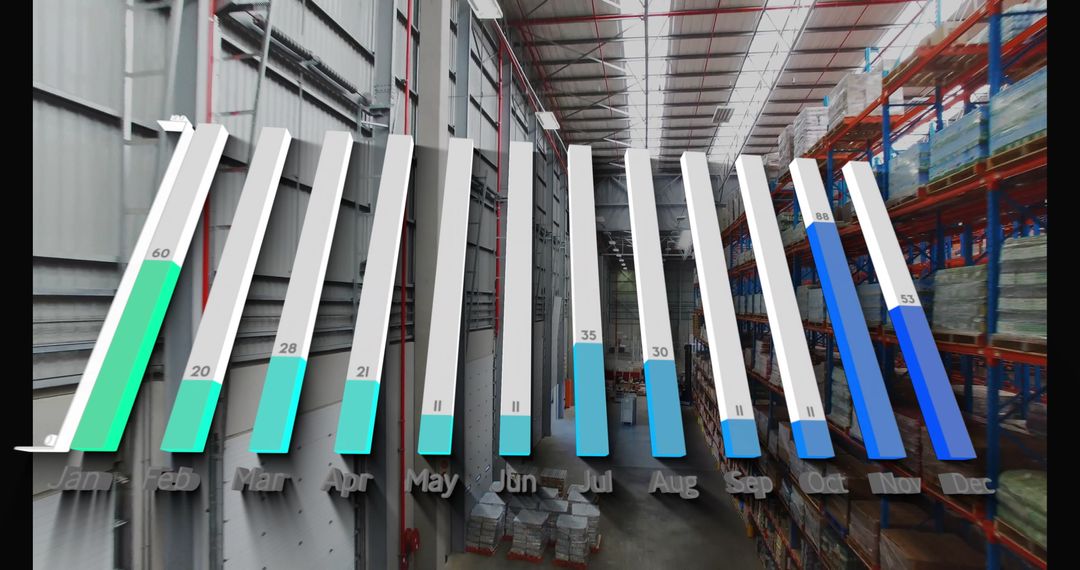
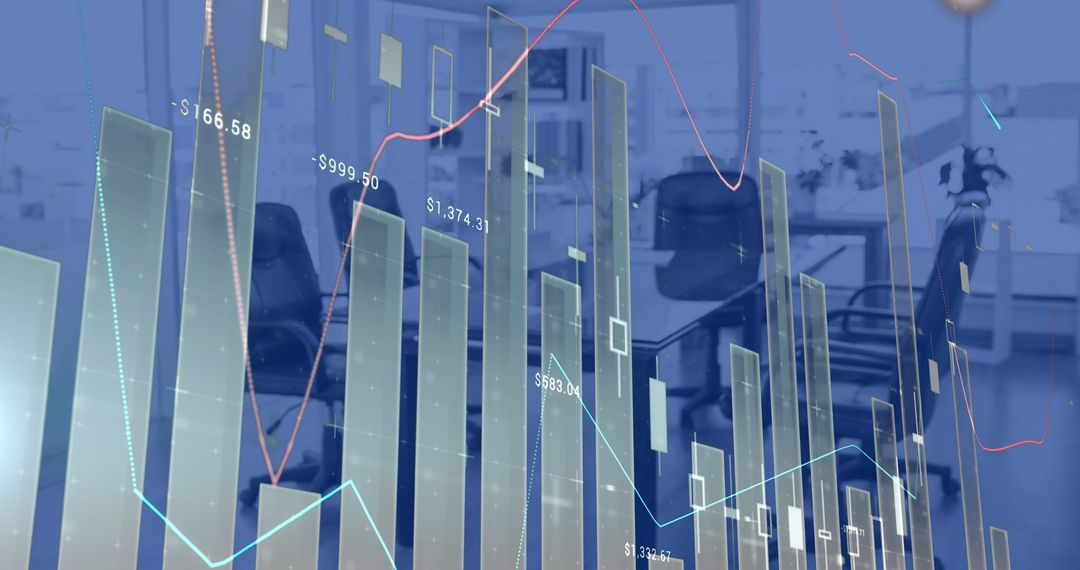
- Bar Graph Visualization with Stock Market Data Background
Bar Graph Visualization with Stock Market Data Background Image

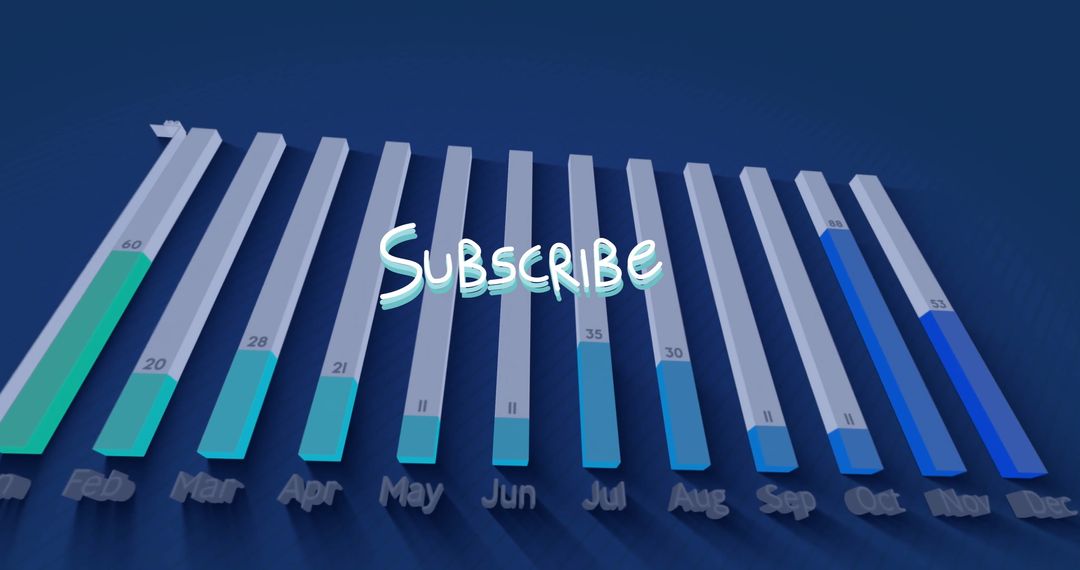
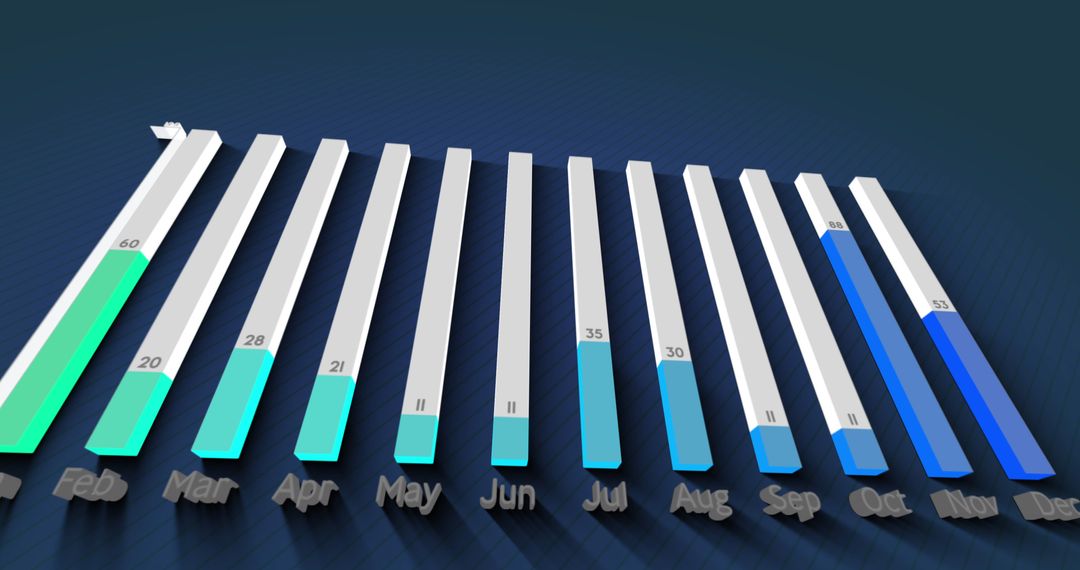
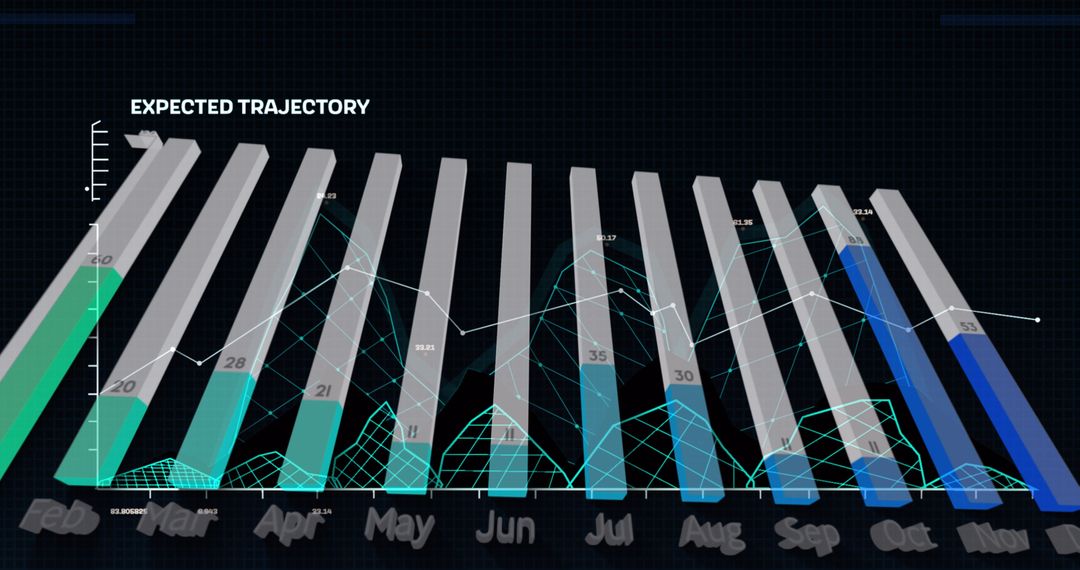
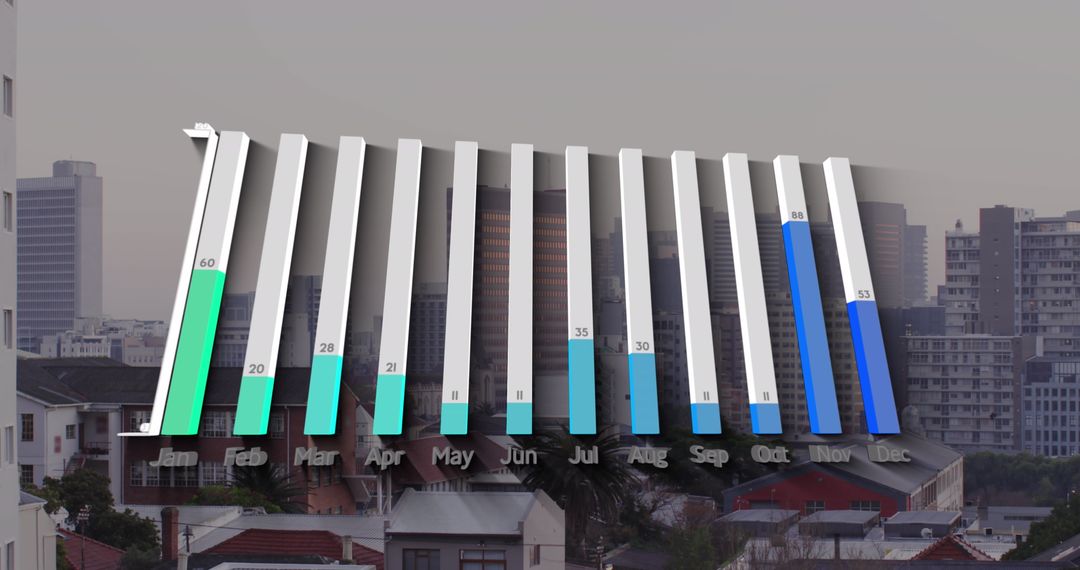
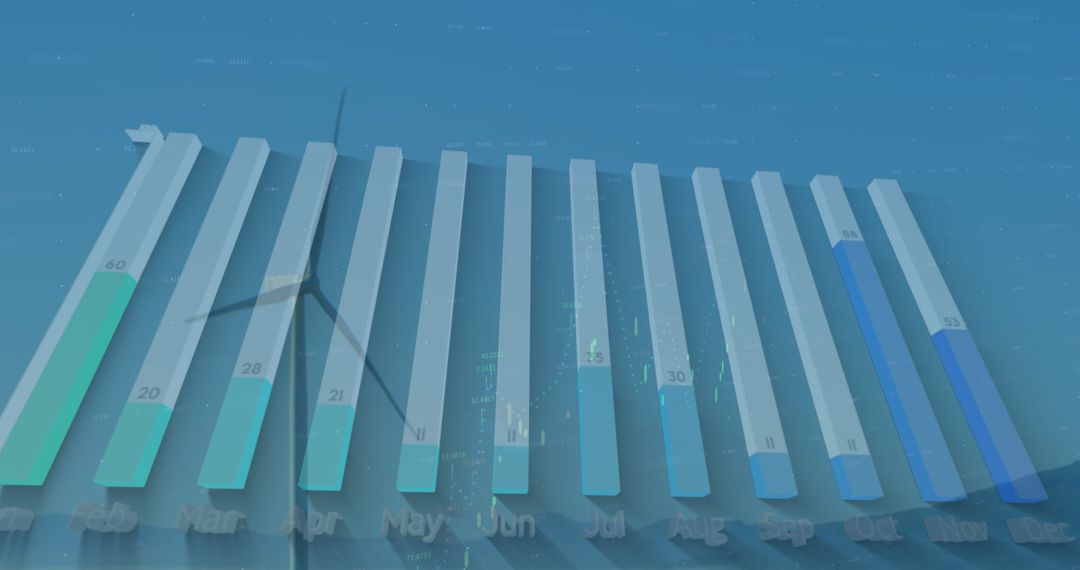
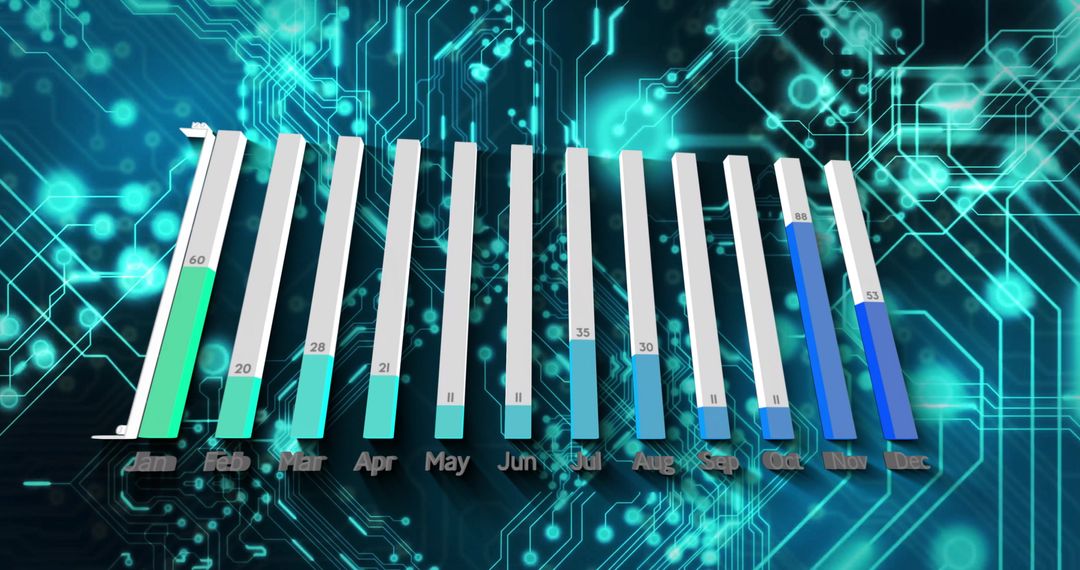
Innovative bar graph integrated with financial and stock market indicators representing analytics. Useful for presentations on finance, aiding in the analysis of trends, or illustrating economic strategies.
Powered by  - Get 15% off with code: PIKWIZARD15


4
downloads
downloads
Tags:
More
Credit Photo
If you would like to credit the Photo, here are some ways you can do so
Text Link
photo Link
<span class="text-link">
<span>
<a target="_blank" href=https://pikwizard.com/photo/bar-graph-visualization-with-stock-market-data-background/74328565a4fbaf4d375291f1c3b909f0/>PikWizard</a>
</span>
</span>
<span class="image-link">
<span
style="margin: 0 0 20px 0; display: inline-block; vertical-align: middle; width: 100%;"
>
<a
target="_blank"
href="https://pikwizard.com/photo/bar-graph-visualization-with-stock-market-data-background/74328565a4fbaf4d375291f1c3b909f0/"
style="text-decoration: none; font-size: 10px; margin: 0;"
>
<img src="https://pikwizard.com/pw/medium/74328565a4fbaf4d375291f1c3b909f0.jpg" style="margin: 0; width: 100%;" alt="" />
<p style="font-size: 12px; margin: 0;">PikWizard</p>
</a>
</span>
</span>
Free (free of charge)
Free for personal and commercial use.
Author: People Creations
Similar Free Stock Images

Premium


Premium


Premium


Premium


Premium


Premium


Premium

Premium


Premium


Premium


Premium


Premium


Premium


Premium


Premium


Premium


Premium


Premium


Premium


Premium


Premium


Premium


Premium


Premium