- Home >
- Stock Photos >
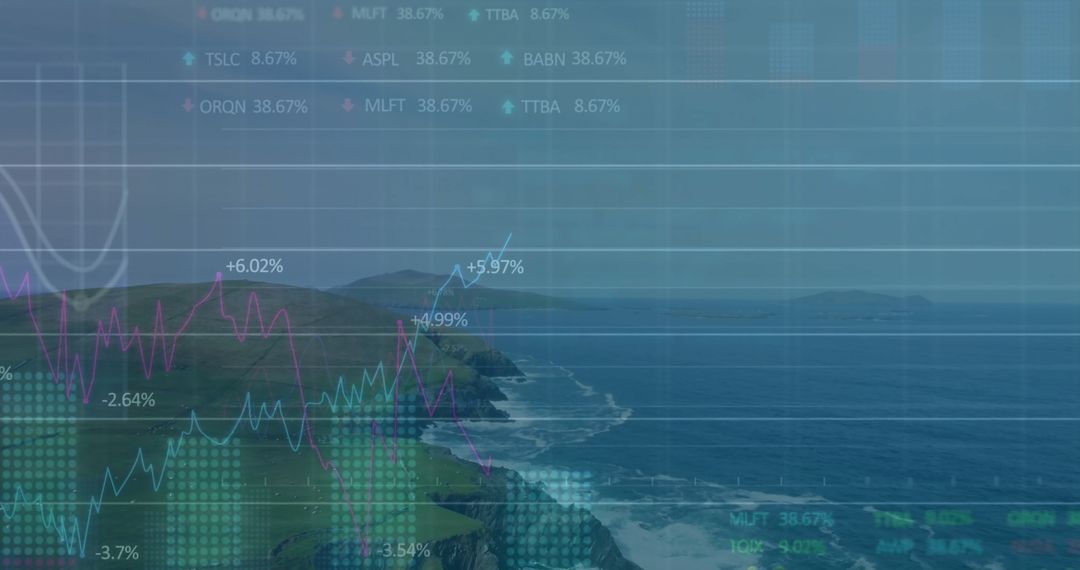
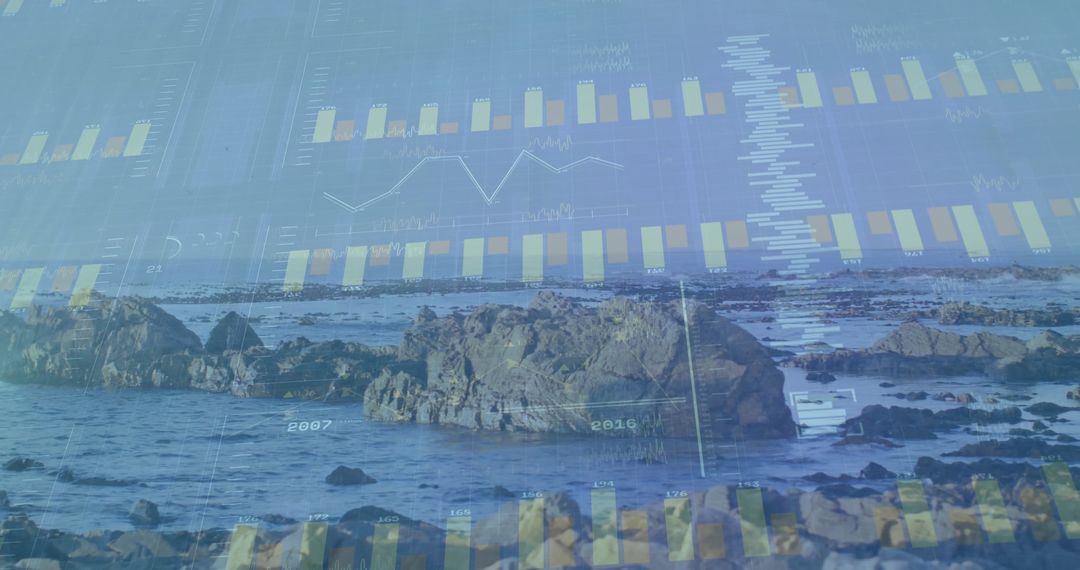
- Bar Graph with Declining Trend Overlay on Coastal Landscape
Bar Graph with Declining Trend Overlay on Coastal Landscape Image

Abstract scene showcasing bar graph with declining trend against a backdrop of rocky coastal islands and water. Ideal for use in presentations relating to financial analysis, environmental impact studies, or digital transformation projects. Provides a creative blend of natural landscapes and digital analytics for compelling storytelling in both corporate and creative contexts.
Powered by 


0
downloads
downloads
Tags:
More
Credit Photo
If you would like to credit the Photo, here are some ways you can do so
Text Link
photo Link
<span class="text-link">
<span>
<a target="_blank" href=https://pikwizard.com/photo/bar-graph-with-declining-trend-overlay-on-coastal-landscape/a493b4e8bf5cf89fd32854870d739450/>PikWizard</a>
</span>
</span>
<span class="image-link">
<span
style="margin: 0 0 20px 0; display: inline-block; vertical-align: middle; width: 100%;"
>
<a
target="_blank"
href="https://pikwizard.com/photo/bar-graph-with-declining-trend-overlay-on-coastal-landscape/a493b4e8bf5cf89fd32854870d739450/"
style="text-decoration: none; font-size: 10px; margin: 0;"
>
<img src="https://pikwizard.com/pw/medium/a493b4e8bf5cf89fd32854870d739450.jpg" style="margin: 0; width: 100%;" alt="" />
<p style="font-size: 12px; margin: 0;">PikWizard</p>
</a>
</span>
</span>
Free (free of charge)
Free for personal and commercial use.
Author: People Creations
Similar Free Stock Images

Premium


Premium


Premium


Premium


Premium


Premium


Premium


Premium


Premium


Premium


Premium


Premium


Premium


Premium


Premium


Premium


Premium


Premium


Premium


Premium


Premium


Premium


Premium


Premium