- Home >
- Stock Photos >
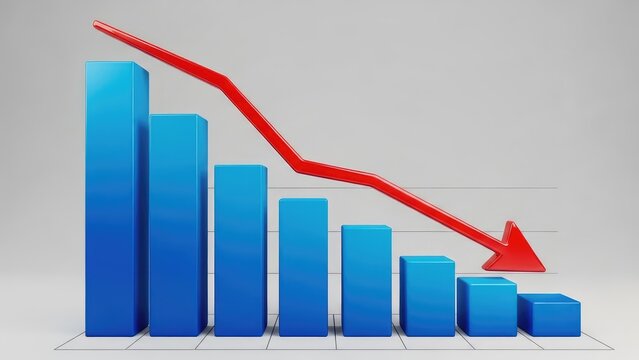
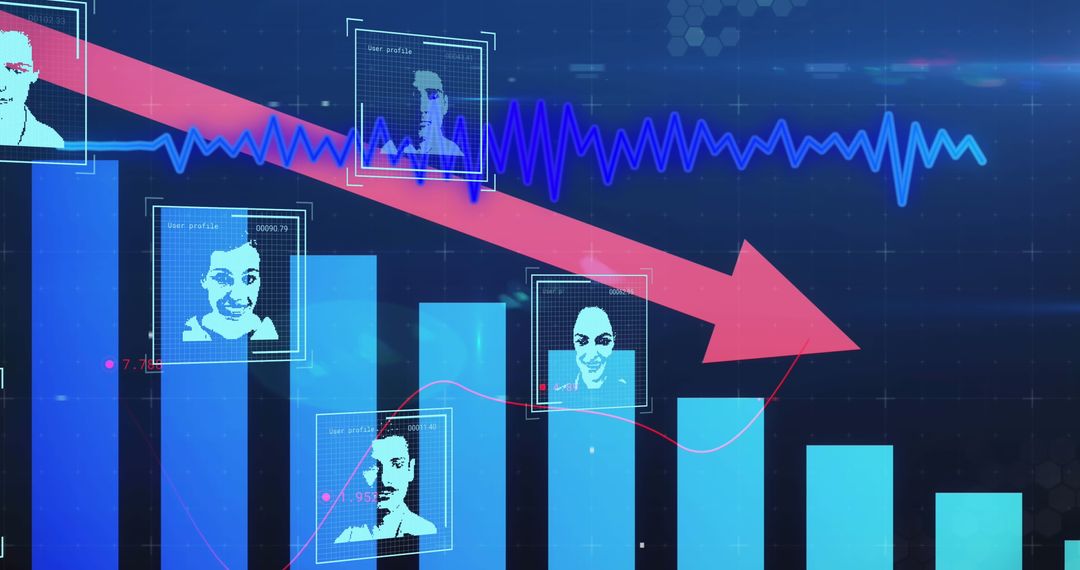
- Bar Graph with Downward Trend and Heartbeat Line
Bar Graph with Downward Trend and Heartbeat Line Image

Illustrates a declining trend in economic or business data. Useful for presentations on economic forecasts, business analysis, and financial reports. Modern digital elements suggest themes in technological or medical analytics.
Powered by 


0
downloads
downloads
Tags:
More
Credit Photo
If you would like to credit the Photo, here are some ways you can do so
Text Link
photo Link
<span class="text-link">
<span>
<a target="_blank" href=https://pikwizard.com/photo/bar-graph-with-downward-trend-and-heartbeat-line/7b82ebf34b98545a15fe5929dce9c06e/>PikWizard</a>
</span>
</span>
<span class="image-link">
<span
style="margin: 0 0 20px 0; display: inline-block; vertical-align: middle; width: 100%;"
>
<a
target="_blank"
href="https://pikwizard.com/photo/bar-graph-with-downward-trend-and-heartbeat-line/7b82ebf34b98545a15fe5929dce9c06e/"
style="text-decoration: none; font-size: 10px; margin: 0;"
>
<img src="https://pikwizard.com/pw/medium/7b82ebf34b98545a15fe5929dce9c06e.jpg" style="margin: 0; width: 100%;" alt="" />
<p style="font-size: 12px; margin: 0;">PikWizard</p>
</a>
</span>
</span>
Free (free of charge)
Free for personal and commercial use.
Author: People Creations
Similar Free Stock Images

Premium


Premium


Premium


Premium


Premium


Premium


Premium


Premium


Premium


Premium


Premium


Premium


Premium


Premium


Premium


Premium


Premium


Premium


Premium


Premium


Premium


Premium


Premium


Premium