- Home >
- Stock Photos >
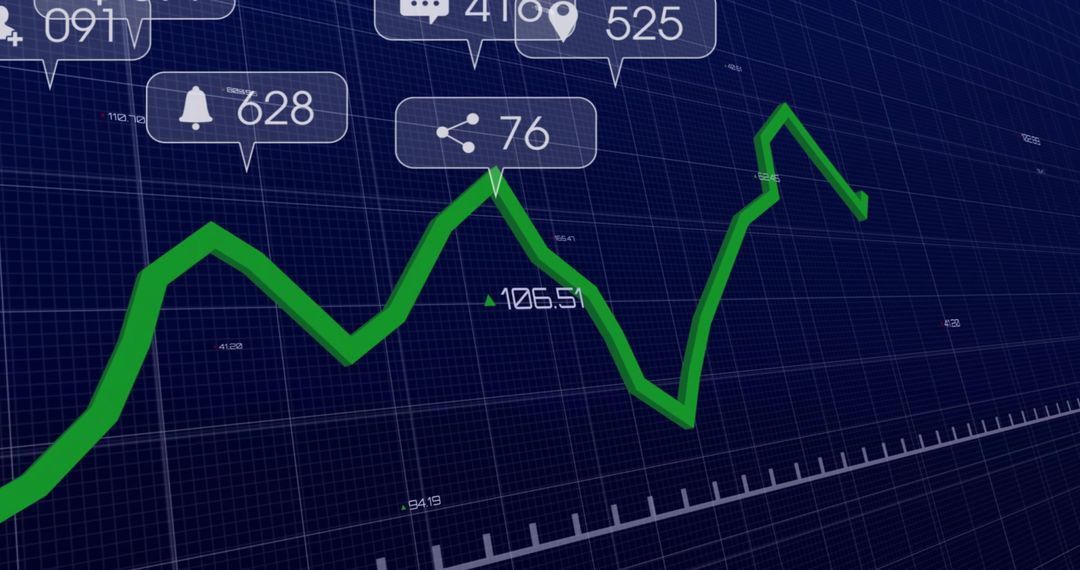
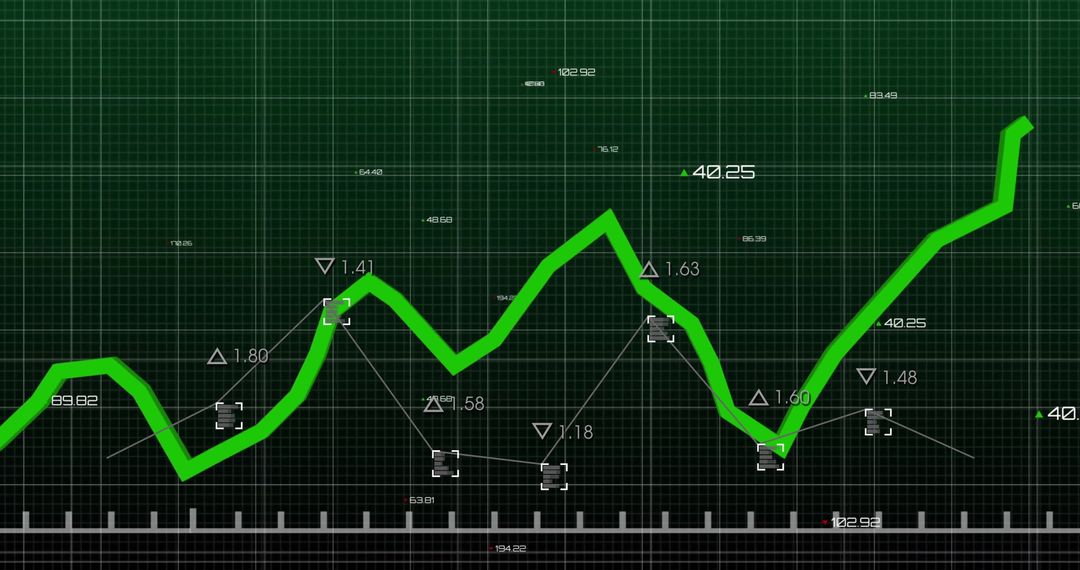
- Beveled Green Trend Line Moving Across Dark Blue Grid Showing Market Data Visualization
Beveled Green Trend Line Moving Across Dark Blue Grid Showing Market Data Visualization Image

Featuring beveled green trend line moving across dark blue grid with ruler markings and numeric marker 107.91, conveying market volatility and upward recovery. Clean futuristic aesthetic suiting business and technology themes. Ideal for use in financial reports, market analysis dashboards, fintech interfaces, investor presentations, blog headers, corporate websites, social media graphics, and advertising campaigns. Working well as hero banner, slide background, data visualization mockup, or infographic element. Color palette supporting overlay text and chart labels; cropping left or right emphasizing peak or trough for thematic focus.
Powered by 


0
downloads
downloads
Tags:
More
Credit Photo
If you would like to credit the Photo, here are some ways you can do so
Text Link
photo Link
<span class="text-link">
<span>
<a target="_blank" href=https://pikwizard.com/photo/beveled-green-trend-line-moving-across-dark-blue-grid-showing-market-data-visualization/a0d8dc2686db1bd8f7e284bb83503d07/>PikWizard</a>
</span>
</span>
<span class="image-link">
<span
style="margin: 0 0 20px 0; display: inline-block; vertical-align: middle; width: 100%;"
>
<a
target="_blank"
href="https://pikwizard.com/photo/beveled-green-trend-line-moving-across-dark-blue-grid-showing-market-data-visualization/a0d8dc2686db1bd8f7e284bb83503d07/"
style="text-decoration: none; font-size: 10px; margin: 0;"
>
<img src="https://pikwizard.com/pw/medium/a0d8dc2686db1bd8f7e284bb83503d07.jpg" style="margin: 0; width: 100%;" alt="" />
<p style="font-size: 12px; margin: 0;">PikWizard</p>
</a>
</span>
</span>
Free (free of charge)
Free for personal and commercial use.
Author: Awesome Content
Similar Free Stock Images

Premium


Premium


Premium


Premium


Premium


Premium


Premium


Premium


Premium


Premium


Premium


Premium


Premium


Premium


Premium


Premium


Premium


Premium


Premium


Premium


Premium


Premium


Premium


Premium